Energy Exchange

Measuring Fugitive Methane Emissions

In recent days, news reports and blog posts have highlighted the problem of fugitive methane emissions from natural gas production — leakage of a potent greenhouse gas with the potential to undermine the carbon advantage that natural gas, when combusted, holds over other fossil fuels. These news accounts, based on important studies in the Denver-Julesburg Basin of Colorado and the Uinta Basin of Utah by scientists affiliated with the National Oceanic and Atmospheric Administration (NOAA) and the University of Colorado (UC) at Boulder, have reported troubling leakage rates of 4% and 9% of total production, respectively —higher than the current Environment Protection Agency (EPA) leakage estimate of 2.3%.

While the Colorado and Utah studies offer valuable snapshots of a specific place on a specific day, neither is a systematic measurement across geographies and extended time periods  and that is what’s necessary to accurately scope the dimensions of the fugitive methane problem. For this reason, conclusions should not be drawn about total leakage based on these preliminary, localized reports. Drawing conclusions from such results would be like trying to draw an elephant after touching two small sections of the animal’s skin: the picture is unlikely to be accurate. In the coming months, ongoing work by the NOAA/UC team, as well as by Environmental Defense Fund (EDF) and other academic and industry partners, will provide a far more systematic view that will greatly increase our understanding of the fugitive methane issue, though additional studies will still be needed to fully resolve the picture. What follows is a briefing on the fugitive methane issue, including the range of measurements currently underway and the need for rigorous data collection along the entire natural gas supply chain.

Why methane leakage matters. Natural gas, which is mostly methane, burns with fewer carbon dioxide emissions than other fossil fuels. However, when uncombusted methane leaks into the atmosphere from wells, pipelines and storage facilities, it acts as a powerful greenhouse gas with enormous implications for global climate change due to its short-term potency: Over a 20-year time frame, each pound of methane is 72 times more powerful at increasing the retention of heat in the atmosphere than a pound of carbon dioxide. Based on EPA’s projections, if we could drastically reduce global emissions of short-term climate forcers such as methane and fluorinated gases over the next 20 years, we could slow the increase in net radiative forcing (heating of the atmosphere) by one third or more.

Fugitive methane emissions from natural gas production, transportation and distribution are the single largest U.S. source of short-term climate forcing gases. The EPA estimates that 2.3% of total natural gas production is lost to leakage, but this estimate, based on early 1990’s data, is sorely in need of updating. The industry claims a leakage rate of about 1.6%. Cornell University professor Robert Howarth has estimated that total fugitive emissions of 3.6 to 7.9% over the lifetime of a well.

To determine the true parameters of the problem, EDF is working with diverse academic partners including the University of Texas at Austin, the NOAA/UC scientists and dozens of industry partners on direct measurements of fugitive emissions from the U.S. natural gas supply chain. The initiative is comprised of a series of more than ten studies that will analyze emissions from the production, gathering, processing, long-distance transmission and local distribution of natural gas, and will gather data on the use of natural gas in the transportation sector. In addition to analyzing industry data, the participants are collecting field measurements at facilities across the country. The researchers leading these studies expect to submit the first of these studies for publication in February 2013, with the others to be submitted over the course of the year. Read More »

Posted in Methane, Natural Gas / Tagged , , | Read 4 Responses

More To Come On Methane…

Concerns around the impacts of methane emissions have reemerged in headlines, with the release of a methane leakage study about Boston. Published in the journal of Environmental Pollution a couple weeks ago, researchers from Boston University and Duke University measured atmospheric methane concentrations leaking from natural gas pipelines in Boston many of which are over a hundred years old. Another report issued last week by researchers at the Massachusetts Institute of Technology (published in Environmental Research Letters) looked at the impact of shale gas production on greenhouse gas emissions.

When talking about harmful greenhouse gases, carbon dioxide (CO2) usually gets most of the attention. Yet methane, the main ingredient in natural gas, is a short-lived greenhouse gas many times more potent than CO2 – or around 72 times more potent over a 20-year time frame. Stakes are high for the scientific community to fully understand the implications of methane leakage rates. These reports help elevate the issue that methane leakage matters to the climate and air quality, but this is only part of the story.

Methane is potentially leaking from the entire natural gas supply chain — from wells, pipelines and storage facilities — and no one knows precisely how much is leaking and where the leaks are stemming from. Some reports estimate the total methane leakage rate occurring during natural gas production, transmission and distribution to range anywhere from 1 to 7.9 percent. At the same time, the data that the Environmental Protection Agency (EPA) and everyone else rely on were collected 20 or more years ago.

A challenge for understanding the distribution of methane concentration data in Boston is that no one knows how to interpret the data yet. Maps of methane concentrations in the urban environment can be spurious. They may look scary, but are they? This and many other tough scientific questions still need to be answered, we are very early in the process of understanding how much methane is leaking and from where. The scientific community at large, including EDF and the authors of the Boston study, are committed to collecting the data necessary to addressing these concerns and to understanding the true climate impact of methane emissions.

EDF is working with leading academic researchers and industry leaders to conduct scientifically rigorous measurements of quantitative emissions across the natural gas supply chain from well to the end user. We are developing the methodologies where necessary to move past a ‘he said, she said’ conversation to one focused on data characterizing leak rates. The critical next step for us in using the increasingly robust data gathered from new innovative technologies is to precipitate a clear enough understanding of where the leaks are in the supply chain to catalyze a constructive conversation about what new policies and industry practices will be required to minimize methane leakage.

The first EDF fugitive methane report, focused on field measurements made at natural gas production sites, will be completed early next year under the leadership of the University of Texas Austin. EDF and our partners are using a diverse array of measurement techniques to characterize leak rates. We are also working to make basin-wide measurements within areas of natural gas production. Over the course of 2013 and early 2014, studies of emissions at other key components in the supply chain, including the local distribution system, will be completed and the data and conclusions released to the public.

EDF is actively campaigning to ensure that fugitive methane emissions from the natural gas industry are less than 1 percent of production in order to ensure that the climate benefits of natural gas are maximized. We see development of innovative, cost effective and accurate methane detection technologies and procedures as a necessary part of minimizing leak rates. Our view is that minimizing methane leakage is an important enough issue that we need to take the time to establish a scientific understanding of the underlying issues and by doing so defining effective well-targeted actions.

Posted in Climate, Methane, Natural Gas / Read 1 Response

Texas Electricity Generation Plan Focuses On Fossil Fuels Instead of Diverse Infrastructure That Includes Renewables & Efficiency

Last week, the Public Utilities Commission of Texas (PUC) voted to approve a staged increase of wholesale offer price caps in the Texas electric market for the Electric Reliability Commission of Texas (ERCOT) in order to prop up lackluster investment interest in new power plants. This change fits well with established theories of competitive markets, but it does little to resolve current issues beyond sending a signal to investors that the PUC intends to act further to incentivize investment in new generation.

That same day, the commissioners “swatted aside” a petition to revisit the state’s goal for non-wind renewable energy without allowing any public discussion.  Given our need for new drought-proof energy and the fact that solar costs have fallen 80 percent in the last three years, this seems like an issue the PUC would be eager to take up.  In fact, when PUC Chairman Donna Nelson was pressed during a state senate hearing this spring to identify state policies that had successfully added electric drought-proof resources, she focused on both the state’s Renewable Portfolio Standard (RPS) and energy efficiency goals.

The PUC has now voted twice to raise wholesale offer price caps for electric generation, even though it voted recently to make it more difficult for the state’s energy efficiency programs to succeed by lowering their price caps.  Last week, while voting to increase price caps again, Chairman Nelson noted that the work to ensure new electric generation did not end with that vote.   I hope that’s the case because I want to make sure we can keep the lights (and air conditioning!) on too.  Since the PUC denied the petition to create a rulemaking to expand the RPS, it seems that their work on expanding electric generation is limited to non-renewable, fossil fuel power plants and not much else.  This is unfortunate given the fact that renewable energy is expected to be the world’s second largest source of power by 2015, according to the recently released World Energy Outlook.

Over the last century, Texas has dominated the international energy scene. However, as the playing field changes, we need to make sure that Texas doesn’t fall behind as a state and an international energy leader.  Recent PUC decisions may increase that risk, but their final decisions on a new market structure will likely be the ultimate decider.

Texas and its citizens deserve a competitive and diverse energy infrastructure that allows for a wide variety of characteristics in energy resources such as storage, customer-side energy resources, renewable energy, and cleaner-burning modern natural gas-fired power plants. Anything less will risk not only our state’s near term electric grid reliability, but also our long-term economic viability as well.

Posted in Energy Efficiency, Renewable Energy, Texas / Comments are closed

13:15

Source: “ERCOT Investment Incentives and Resource Adequacy.” Brattle Group. June 1, 2012.

In January, we discussed the benefits of demand response (DR) and how Texas is not taking full advantage of it. Not only is DR a low cost, zero water source for providing capacity through conservation, but it can also actually directly benefit consumers financially. Furthermore, since residential and small customers account for “more than 70 percent of peak load” it is paramount that we tap into this resource.

The 13 Percent Reserve Margin

Fast forward to this summer, where a few factors have encouraged the situation as Texas’ energy crunch comes to light. In May, the 13.75 percent reserve margin became the center of discussion about how to proceed. Set in 2010 by the Electric Reliability Council of Texas (ERCOT) board, the 13.75 percent target planning reserve margin is to ensure enough power is available for contingencies such as extreme weather and unplanned power plant outages. However, a newly revised Capacity, Demand and Reserves (CDR) report shows that in 2014 we may be only at 9.8 percent and by 2015 this could drop to 6.9 percent, numbers that are very far away from the original goal.  A failure to meet this reserve creates instability, not only for the ERCOT market as a whole, but that uncertainty ripples through the state for all businesses and households.

In June, the peak energy forecast for this summer was surpassed. ERCOT had predicted a 66,195 megawatt (MW) peak demand for the whole summer, but we surpassed that with 66,583 MW in June, well before the string of 100+ degree days we have seen recently. 

The 15 Percent Potential From Demand Response

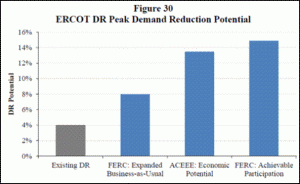
In June the Brattle Report came out reiterating FERC’s studies, which demonstrated that the potential for achievable participation in DR is 15 percent of capacity in Texas.  This means that “dynamic pricing and load control technologies are deployed on an opt-out basis, with roughly 75 percent of customers participating.”

So if Texas met this DR goal of 15 percent it would be enough to cover our reserve margin of 13.75 percent and then some. Without new power plants. Without any new generation capacity at all. While in actuality we would rely on other demand side resources as well – such as distributed generation and storage – it is very important to point out the link between the 13/15 ratio, and how much potential demand response provides us.

Even better is that unlike other mechanisms that do not benefit consumers financially such as the price cap increase, DR and other demand side resources can provide large gains for consumers. Not only do they encourage reductions in energy consumption and thus energy bills, but because there is an added value in providing that “negawatt” capacity back into the system, customers are compensated. As we noted in an earlier blog, in the PJM market, $20 million of the payments went to residential customers!”

While there are still only a few of these initiatives around the country, the momentum is alive. Last year, FERC Rule 745 was established that “requires wholesale energy market operators to pay DR participants the market price for energy when those resources are able to balance supply and demand as an alternative to additional generation, and when DR dispatch is cost-effective.” This lays the foundation for how consumers will be compensated. FERC Chairman Jon Wellinghoff put it well, “[this] final rule is about bringing benefits to consumers. The approach to compensating demand response resources as we require here will help to provide more resource options for efficient and reliable system operation, encourage new entry and innovation in energy markets, and spur the deployment of new technologies. All of this contributes to just and reasonable rates.”

On June 26, ERCOT moved in the right direction by approving a DR pilot project that “will allow eligible participants a half hour to respond to ERCOT requests to reduce their electric use. The program is open to electric users — either as individual customers or as part of an aggregated group of consumers — who can reduce demand on the ERCOT grid by at least 100 kilowatts, which is the amount 20 homes use during peak demand.”

This follows a rule change adopted by the PUC in May that “authorizes ERCOT to conduct pilot projects to ‘evaluate resources, technologies, services, and processes that demonstrate the potential to advance the operational and market functions of the ERCOT system.’ This is the first pilot project approved under the new rule.” EDF commented on these rule changes and we are pleased to see ERCOT moving forward with these pilots. While many more deployments need to begin, we are headed down the right path and finally waking up the innovations needed in the energy market.

Posted in Demand Response, Texas / Read 1 Response

Envision Charlotte Meets Pecan Street

Last week, I, along with several other Envision Charlotte Board Members travelled to visit the Pecan Street smart grid project in Austin, Texas.   We hope this will be the start of a recurring “exchange program” between the two cities for sharing of information and best practices related to smart grid deployment.  There are significant differences between the two projects.  Pecan Street is focused on the residential sector; Envision Charlotte on commercial office buildings.  Envision Charlotte is deploying innovative behavior change, social networking and employee training to reduce energy use, while Pecan Street is heavily focused on technology solutions. 

But, there is also a lot in common.  Both organizations desire to reduce energy use and find alternatives to our outdated energy system.  Both believe that smart grids and energy efficiency can be cost effective and drive economic development.  Finally, both groups are rigorously measuring the impacts of their actions. 

What we saw in Austin was very cool.  We started by visiting a home in the Mueller neighborhood, a playground for testing the latest in home energy management and appliances.  In one house’s garage was a wireless energy monitor that connects to the home’s circuit breaker box and allows homeowners to view real time energy use from different appliances and lighting systems in the home.  Residents now know exactly how much it is costing them to make coffee each morning – or power up their flat screen TV. 

Also in the garage was a Chevy Volt, along with four charging stations from different manufacturers (according to Pecan Street staff, they all perform roughly the same).  Up on the roof was a series of solar panels, whose every watt is being recorded to learn important things about installation location, potential for offsetting peak generation, and storage solutions.  Although each of these technologies are impressive on their own, only when operating together do they represent the next generation of home energy management where consumers have complete knowledge and control over their energy choices.  It’s pretty empowering.

This innovative project didn’t happen accidentally.  It came about through lots of perspiration from their Executive Director and former Austin Council Member Brewster McCracken; design recommendations from hundreds of folks in the private sector, local community and NGOs (including EDF); prodigious fundraising; and hard work from staff, board members, and participating companies.  Some of my key takeaways from the trip are as follows:

Residential Technology Still a Wild West – Unlike the commercial building automation universe, where users have more experience integrating energy management and building systems to speak the same code and talk to one another, residential systems are still in their infancy and competing languages make it extremely difficult to get different pieces of hardware to talk to one another.  Pecan Street will often need to write new code or develop other workarounds to get vendor equipment to work as described.  This is one of the reasons why EDF has joined the OPEN network, to help ensure that smart grid investments in different states maximize interoperability.

The Incredible Power of Data – Pecan Street collects a data point from each home circuit every 15 seconds.  With dozens of circuits per home and hundreds of participating homes in the Mueller development, the Pecan Street project has rapidly approached billions of discrete pieces of data that can be captured, sorted and analyzed.  Although a challenge to work with data sets this large, once properly harnessed, they provide incredible insights to consumers, utilities, researchers and policymakers on energy use.  Pecan Street can see exactly what happens to the grid when someone opens their refrigerator or micro-waves dinner, and use that information to develop strategies for homeowners that will reduce energy use and improve reliability.   

Test Technology, Scale, Inform Policy – Pecan Street is unique in its approach in several ways, but one of the most significant is that it enables a technology to policy pathway.  Pecan Street’s test labs experiment with the latest in home energy management technologies, present those solutions to homeowners in the Mueller neighborhood for adoption and enable EDF to identify regulatory or policy mechanisms that can further accelerate smart grid investment.  As an example, last year EDF was able to help secure provisions in a Texas energy bill that enable demand response programs and payments for utility customers.  This technology to policy approach is something that Envision Charlotte will need to reach our ambitious 5-year, 20% energy reduction goal.

All in all, it was an incredible trip.  Over the coming years, as Envision Charlotte develops more programs and scales its impact, we hope to repay the warm hospitality of Pecan Street by hosting their team in Charlotte and sharing what we have learned.  We’ll promise good conversation, great BBQ and a continued devotion to collaboration.

Posted in Grid Modernization, North Carolina, Texas / Tagged , | Comments are closed

Do Shale Gas Activities Play A Role In Rising Ozone Levels?

This commentary was originally posted on the EDF Texas Clean Air Matters Blog.

Source: AFP

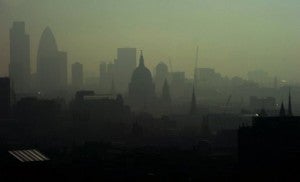
As we continue seeking relief from rising temperatures this month, it’s also time to be on the watch for ozone alerts. The annual Texas smog season – April 1 through October – already appears to be in full swing this year with numerous counties around the state exceeding health-based ozone concentrations many times since March.

Just last week, the Houston Chronicle highlighted the magnitude of ozone exceedances that the area hasn’t seen since 2003. Additionally, the month of May was the nation’s “smoggiest” in the past five years according to a recent report released by Clean Air Watch. Texas ranked second, surpassed only by California, for the most Code Red and Code Orange days so far in 2012, with 18 days and 27 days respectively.

Ozone-forming pollution is emitted by cars, refineries and various industrial plants. As more Texans begin to see shale gas drilling rigs pop up around them, many are asking the question: Could emissions from natural gas and oil operations significantly contribute to ground-level ozone? The answer is an unequivocal yes.

The Role of Natural Gas and Oil in Rising Ozone Levels

While burning natural gas produces less smog-forming pollution than coal combustion but more than renewable energy generation, much of the equipment used in the drilling, production, processing and transporting of natural gas and oil produces significant amounts of such pollution. This equipment releases volatile organic compounds (VOCs) and oxides of nitrogen (NOx), which combine in the presence of sunlight to form ground-level ozone or “smog.” According to the state of Colorado, natural gas and oil operations were the largest source of ozone-forming pollution, VOCs and NOx in 2008.

The Texas Commission on Environmental Quality has reported that storage tanks used in the exploration and production of natural gas and oil are the largest source of VOCs in the Barnett Shale. Recently, there have been additional concerns that San Antonio may not meet federal ozone standards due to Eagle Ford Shale development. Peter Bella, natural resources director at the Alamo Area Council of Governments, told the Houston Chronicle that the city is “right on the edge of nonattainment.”

Ozone concentrations comparable to those recorded in some of the most heavily polluted U.S. cities have been measured in rural parts of Wyoming and Utah, where little other industrial activity occurs:

It’s important to note, however, that ozone monitoring does not exist in many oil and gas development areas, so we don’t know the full extent of the potential problem. For instance, though the Texas Commission on Environmental Quality has committed to start monitoring in the Eagle Ford, there is not currently sufficient monitoring to characterize ozone problems in the area.

Protection of Human Health

As natural gas and oil development expands into new regions, adverse air impacts are likely to follow, absent sufficient emissions controls. It is crucial for states to have strong standards in place, especially for a state such as Texas, which experienced exponential production increases in a short period time. The Eagle Ford Shale alone saw a 432 percent increase in natural gas production from 2010 to 2011.

We are happy to report that EPA recently finalized clean air measures that will serve as an important first step in reducing harmful pollution discharged from a variety of oil and natural gas activities. In fact, last month, EDF President Fred Krupp testified before the U.S. Senate in support of these new clean air standards, which will result in significant reductions in smog-forming pollutants and hazardous air pollutants like benzene, a known carcinogen. As a co-benefit, the standards will also reduce methane, a potent climate forcer.

In his testimony, he said “these common sense measures are a win-win: they reduce pollution, conserve valuable domestic energy resources, and in some cases, actually save producers money.” He added that it was “critical that we build on these clean air measures if our nation is to fulfill the President’s promise in his State of the Union to develop natural gas without putting the health and safety of our citizens at risk.”

While mounting evidence continues to link natural gas drilling with rising ozone levels, it is important to remember why we should care in the first place:

  • Ozone has been linked to a host of maladies, including premature mortality, heart failure, increased hospital admissions and emergency room visits for respiratory causes among children and adults with pre-existing respiratory disease, such as asthma and inflammation of the lung, and possible long-term damage to the lungs.
  • Children, the elderly, and people with existing respiratory conditions are the most at risk from ozone pollution.
  • Ozone also damages crops and ecosystems. Ozone is one of the most phytotoxic air pollutants – causing damage to vegetation in national parks and wilderness areas, especially in mountain regions and to valuable crops.
  • Ozone pollution also contributes to climate change. According to the Intergovernmental Panel on Climate Change (IPCC), ozone is the third-largest contributor to climate change after carbon dioxide and methane.

In the end, we’re talking about the protection of human health as well as our entire planet. Continue to visit this blog for updates on rising ozone levels in our state, as well as other vital information related to Texas air quality.

Posted in Climate, Natural Gas, Texas / Tagged | Read 2 Responses