


Data helps prioritize gas line replacement
By Simi Rose George and Virginia Palacios
A new method of prioritizing gas infrastructure improvements is resulting in faster reductions of greenhouse gas emissions in New Jersey. Just over a year ago, we wrote about an order from the state’s Board of Public Utilities approving a settlement agreement for a $905 million, three-year pipe replacement program by PSE&G, New Jersey’s largest gas utility. This order, and the underlying settlement agreement were pioneering in one major aspect – PSE&G agreed to use environmental data to inform its infrastructure improvement efforts.
The order provided that the company would use data on leak flow rate (the speed at which methane is leaking from gas pipes) to help prioritize its local distribution pipe (“gas line”) replacement program. PSE&G is the first utility in the country to do so. The idea was that this data would be gathered by EDF as part of a collaborative project with Google Earth Outreach and Colorado State University through a survey of sections of PSE&G’s service territory targeted for gas line replacement.
Methane, the main constituent of natural gas, is a powerful greenhouse gas 84 times more potent than carbon dioxide over a 20-year time frame. Replacing the leakiest gas lines first (after safety has been considered) means emissions can be reduced much more rapidly. In this way, PSE&G is generating benefits not only for the environment and public safety, but also for ratepayers, who pay the costs of leaked gas.
In Practice
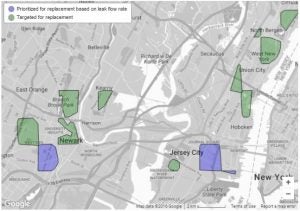
Working with our partners, we surveyed 30 one-square-mile grids in PSE&G’s service territory, using a Google Street View car specially outfitted with methane sensors. PSE&G shared the type and location of the gas lines they were looking to replace, making it possible to orient the survey efforts in a manner responsive to the Company’s pipe replacement program. Readings were taken from May 2015 through November 2015.
As always, safety factors remain paramount in the prioritization of PSE&G’s pipe replacement efforts. What the new dataset on leak flow rate provides to PSE&G is a layer of insight not previously available. Where two or more grids have a comparable safety ranking and are not immediately hazardous, PSE&G is addressing the one with the higher methane emissions first. This allows the company to co-optimize environmental, ratepayer and safety benefits.
Impacts
We found an average of about one leak per mile of gas line within the 30 grid areas surveyed. Similar to other national studies on distribution pipeline leaks, we found that a few large leaks contributed to a substantial portion of the emissions we found.
PSE&G prioritized three grids for replacement based on leak flow rate, after replacing gas lines in all the grids that were deemed to have the highest safety risk. These three grids accounted for 37% of the total emissions we quantified, but represented only 9% of the gas line miles in the 30 grids that were surveyed.
Our analysis shows that using leak flow rate for prioritizing pipe replacement allowed PSE&G to achieve an 83% reduction of quantified methane emissions by replacing one-third fewer miles of gas lines than it would have needed to replace in order to achieve the same level of emission reduction under a business-as-usual scenario. These figures take on greater meaning when you consider that the average costs of replacement per mile of gas line on PSE&G’s system ranges from $1.5-$2 million.
The Bigger Picture
These findings have important implications for utilities across the country. In 2011, the Department of Transportation and the federal Pipelines and Hazardous Materials Safety Administration (PHMSA) issued a joint call to action to all state pipeline regulatory agencies, technical and subject matter experts, and pipeline operators to accelerate repair, rehabilitation, and replacement of the highest-risk pipeline infrastructure. According to PHMSA, cast iron pipes, which are considered to be high risk infrastructure, represent approximately 30 percent of the total leak-prone pipe in the country. The U.S. Department of Energy estimates that the total cost of replacing cast iron and bare steel pipes in gas distribution systems is a massive $270 billion, underscoring the need to direct this investment in the most optimal way possible.
Our analysis shows that methane emissions reductions can be achieved more quickly nationwide if cutting edge leak quantification methods are used to prioritize cast iron distribution pipeline replacement programs. If PSE&G’s ratio of emissions to gas line miles (37% of emissions from just 9% of lines surveyed) were to be found nationally, prioritizing replacements using the method employed by PSE&G for 9% of the highest-emitting cast iron gas lines in the nation could result in 12,000 tons of methane emission reductions. That would have the same climate benefit as taking over 200,000 cars off the roads each year.
More Progress
Other utilities are exploring new leak quantification methods. EDF recently concluded a pilot project with Con Edison to characterize its backlog of non-hazardous leaks in Westchester County in New York. Con Edison will use this data to prioritize repairs of these leaks, addressing the largest ones first. Analysis of the data found that more than half the emissions could be eliminated by addressing the largest 18% of the leaks.
EDF is continuing to advocate before regulatory commissions across the country for this new method of implementing gas infrastructure improvements to be adopted more broadly by utilities. In the meantime, PSE&G is leading the way in using data and analytics to inform its asset management decisions.