New study shows huge variation in how different oil companies manage climate pollution – underscores need for more oversight
 By Jon Goldstein and Ben Hmiel
For the last several years, researchers have been studying methane emissions in the Permian Basin (the nation’s largest oil field) to try and understand just how much climate pollution specific oil companies may be responsible for. A new study published this week from EDF and Carbon Mapper offers insights into how we answer that question.
The study looks at emission data gathered by aircraft during a series of flights conducted between 2019 and 2021 and cross references that information with what is known about the individual companies operating in the area and how much oil and gas they produce.
New study shows huge variation in how different oil companies manage climate pollution – underscores need for more oversight Share on XAttributing emissions to specific operators and sites can be complicated. Wind can impact our ability to know where exactly emissions may have originated from. And certain technologies — like those used for this study — can scan massive regions for emissions but can only detect very large plumes of methane. Additionally, oil and gas assets can change hands frequently, making it difficult to know what company owns which well site at what time.
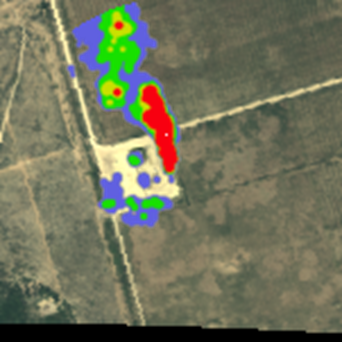
Plume image from Carbon mapper. Data collected from the aircraft surveys enables researchers to assign large emission plumes to specific sites and facilities.
To help eliminate the uncertainty of these conditions, we zeroed in on the 14 companies that make up about 85% of production in a highly productive portion of the basin. The aircraft, which flew over the area about 40 different times between 2019 and 2021, detected at least 15 large plumes from each of these operators — giving us a good baseline from which to compare performance over the years.
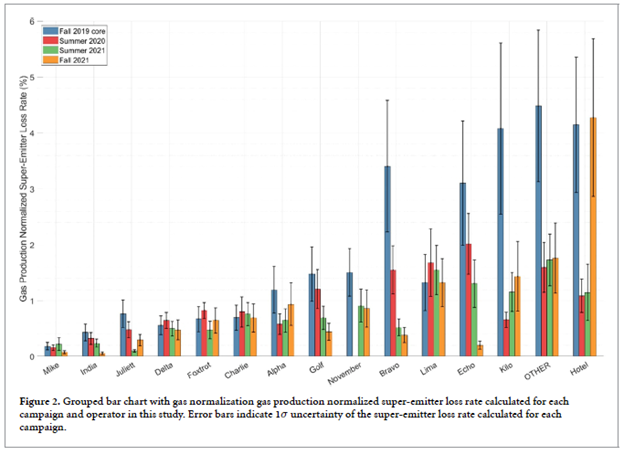
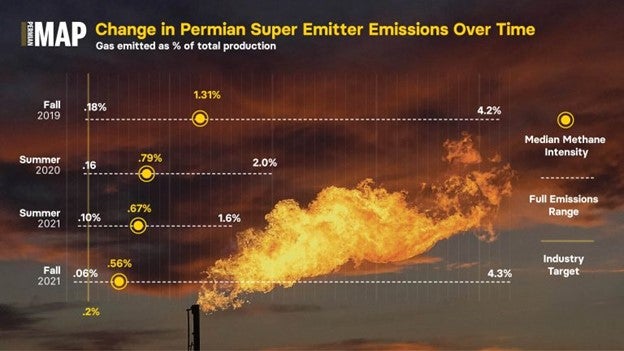
We saw significant variation among the companies. One had a leak rate (a calculation of how much methane is released compared to how much gas is produced) of just .1%. Others, however, were emitting over 4% of their gas directly into the atmosphere. This is 20 times higher than what many companies have committed to. And since the aircraft used in this research can only quantify the largest plumes, these intensities likely underestimate the true emissions from the region.
 This bar chart reveals the different operator leak rates over the course of the research. Operator names have been anonymized.
The significant variation between operators indicates that not all companies are implementing the best practices when it comes to controlling pollution.
The Environmental Protection Agency recently proposed new standards designed to help curb methane pollution from oil and gas facilities. The glaring difference between company performance identified in this research suggests that such actions could be hugely beneficial for getting all operators to follow the known best practices that lead to less pollution.
The United States also recently passed the Inflation Reduction Act, which places a charge on excessive pollution. Methods like those used in this study — especially when paired with other transparent methane reporting efforts — can be hugely influential in helping to identify the largest polluters and hold them accountable.
One heartening observation of this study is that company performance did improve slightly over time.
It’s difficult to attribute this progress to any one specific factor, though it very likely could be due to the heightened scrutiny being placed on oil and gas companies and their contribution to climate change, as well as the increase in global methane monitoring efforts. As regulatory oversight improves and methane detecting technologies continue to advance, the picture of the largest polluters will become even clearer.
One thing is for certain, it’s absolutely possible to reduce greenhouse gas emissions from fossil fuel development with tools and technologies on the shelf today. How much we reduce and how fast we do it requires transparent pollution data and stronger oversight of the oil and gas industry.


