Market Forces

How EDF’s new, groundbreaking EJ mapping tool can drive equitable policies and investment

Last Monday, Environmental Defense Fund and Texas A&M University unveiled the Climate Vulnerability Index (CVI), a robust, data-driven mapping tool built to highlight how drivers of cumulative vulnerability and exposure to climate impacts disadvantage communities across the U.S. Combining 184 sets of data, or “indicators,” to rank more than 70,000 U.S. Census tracts, the CVI offers the most complete look at lived experience down to the neighborhood level.  Read More »

Posted in Uncategorized / Leave a comment

Understanding how communities are vulnerable to climate change is key to improving equity and justice

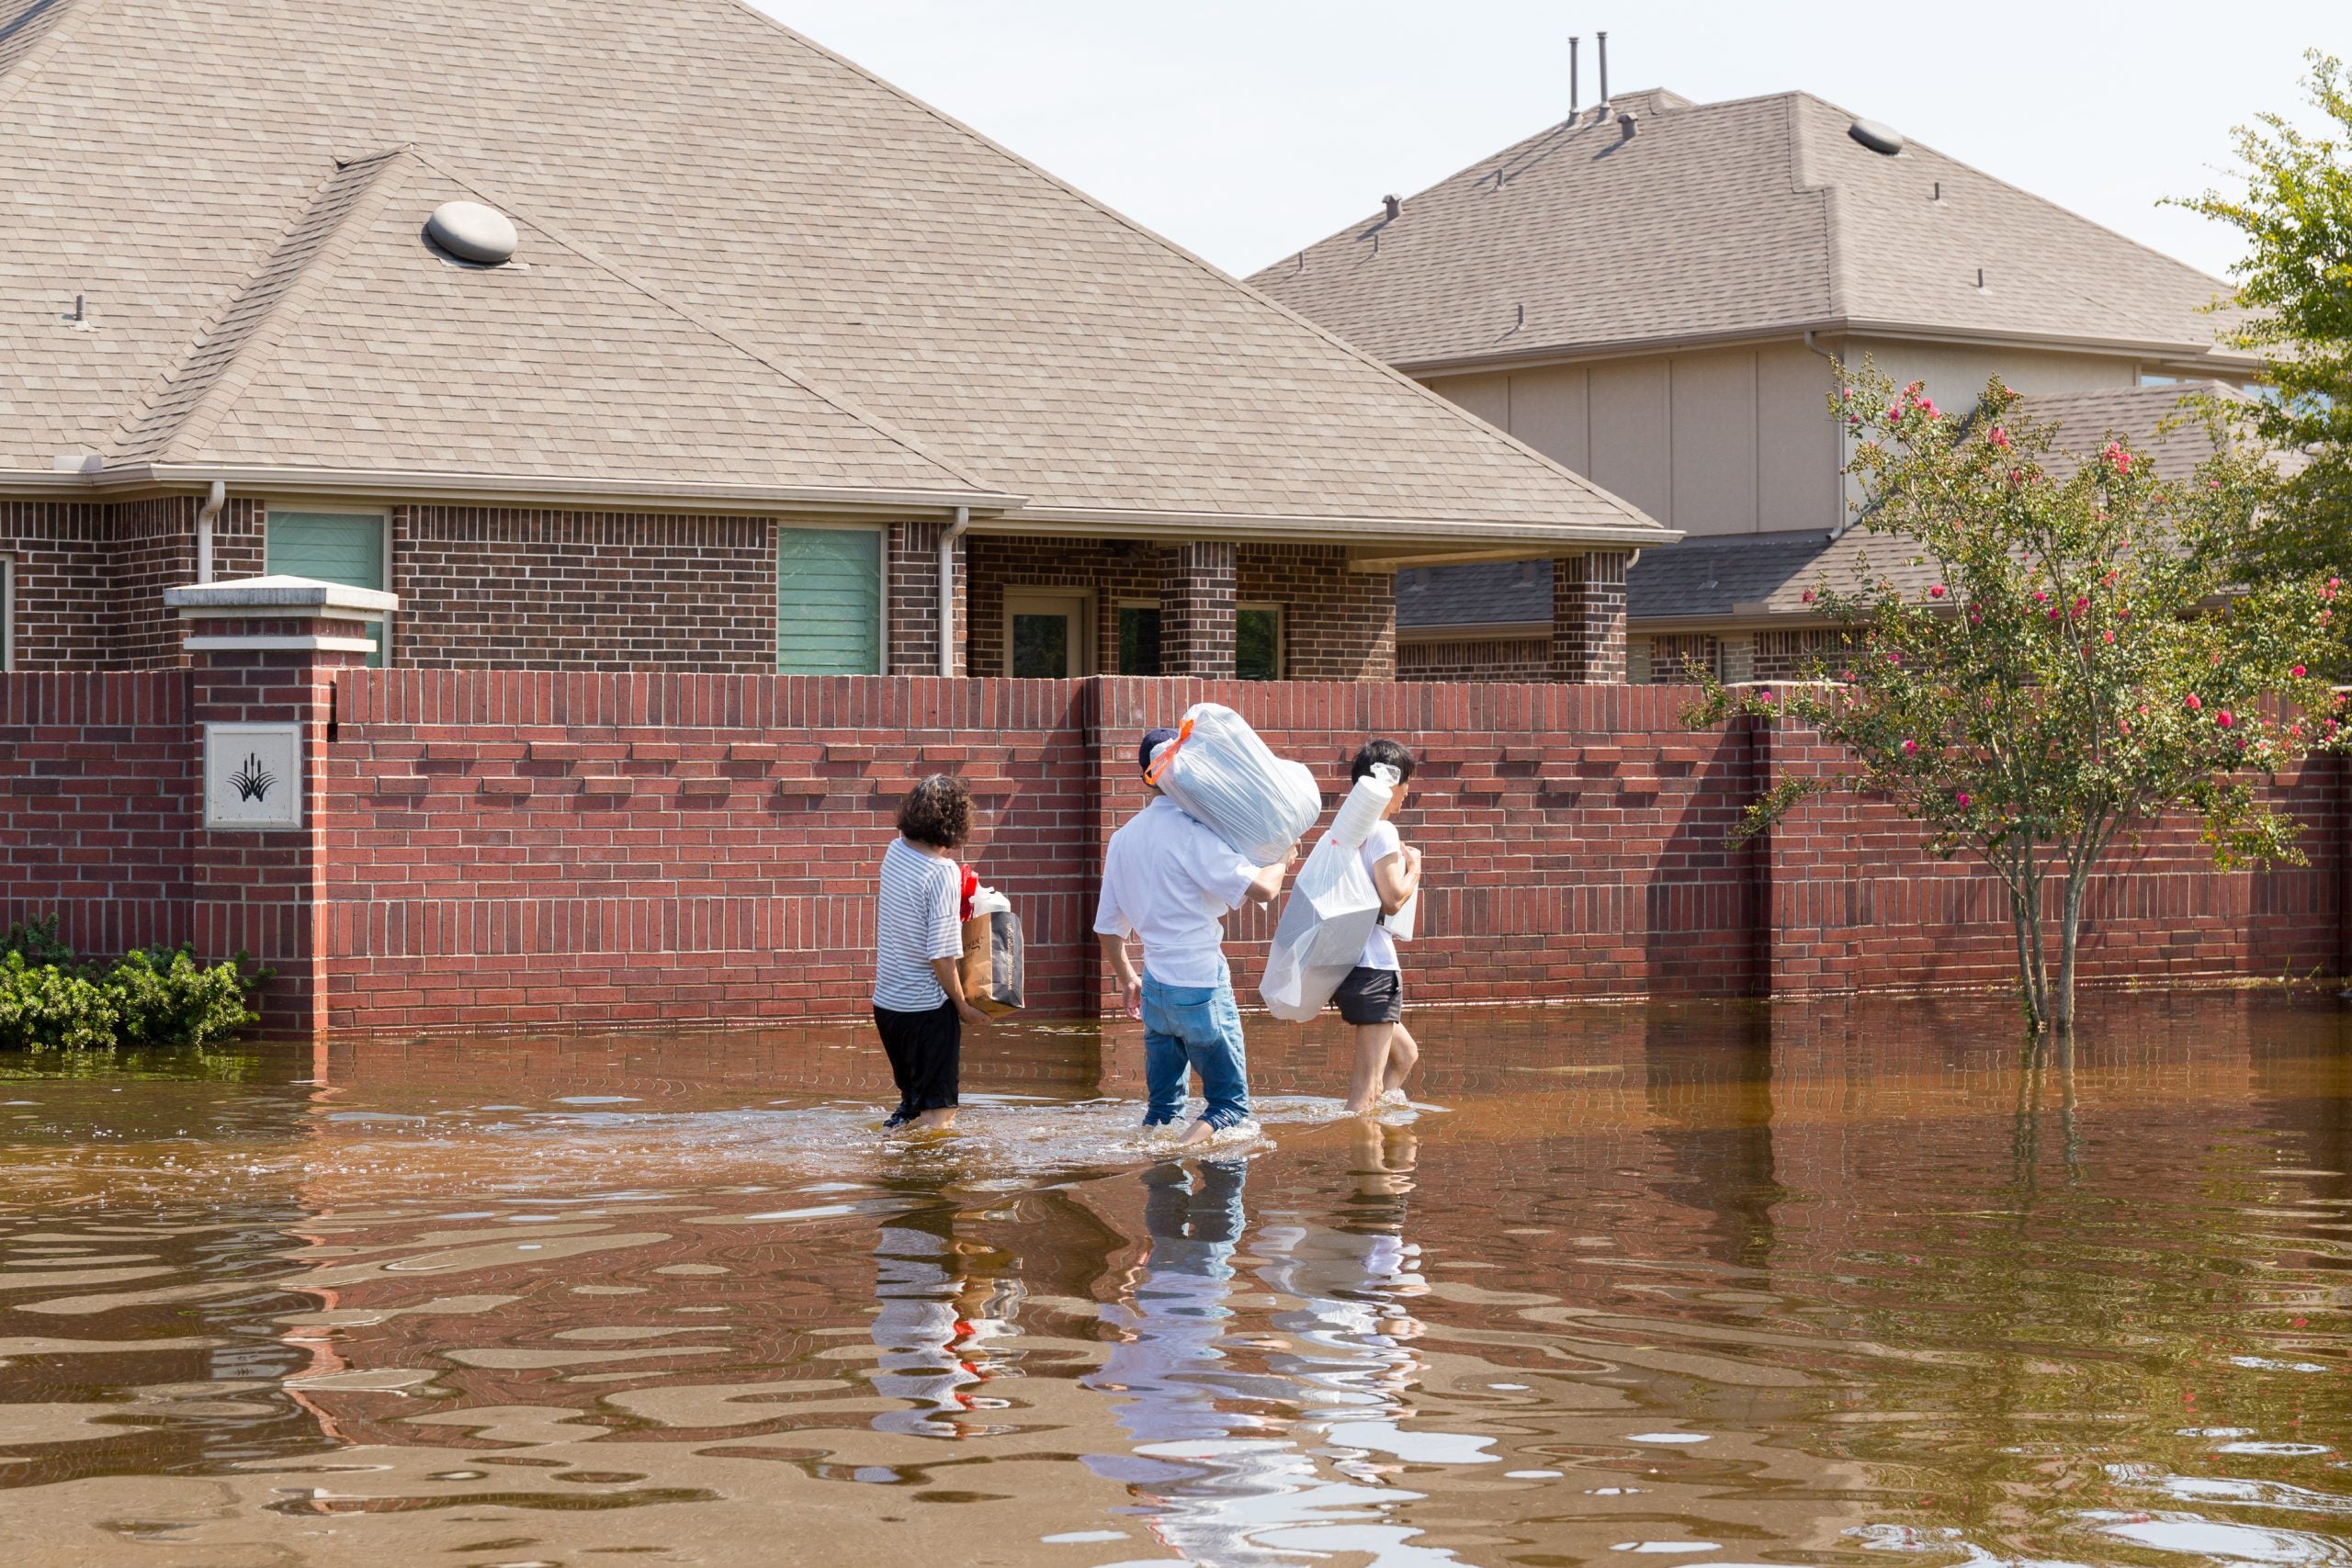
Hurricane Harvey dropped more than 60 inches of rain on the greater Houston region in 2017.

This blog was co-authored by Dr. Grace Tee Lewis, Senior Health Scientist, Climate and Health

Last month, Environmental Defense Fund and Texas A&M University published a new study that found all states in the U.S. are at risk from the effects of climate change, particularly neighborhoods experiencing disproportionate environmental harms and risks, health disparities and infrastructure problems. We published our research paper, Characterizing vulnerabilities to climate change across the United States, in response to a growing push to identify and address these climate injustices and inequities. This movement is exemplified by the Biden Administration’s executive order to ensure environmental and economic justice are key considerations in how the administration governs on the issue of climate change.  

With the Biden Administration’s recent legislation – including the Inflation Reduction Act, Bipartisan Infrastructure Bill and Creating Helpful Incentives to Produce Semiconductors and Science Act (IRA, BIF and CHIPS) – we have a historic opportunity to tackle decades of systemic neglect in low-income neighborhoods and communities of color. We can help level the playing field by directing resources to build resilience and adaptability in the right places across our country.

Read More »

Posted in Climate Change / Leave a comment

Creating Data to Support Communities on the Front Lines of Oil and Gas Production in the US

This blog was co-authored by Kate Roberts.

This week we published a new study that combines locations of active oil and gas wells with census tract data in a way that helps us better understand the characteristics of the communities living near them. Our findings support what environmental justice groups have been voicing for years: in many counties across America, people who have been historically marginalized–communities of color, older Americans, children, and people living under the federal poverty line–often live near wells in greater proportions than the other groups that make up the rest of their local county.

In addition to publishing these data with our study, we also used it to develop an interactive tool, which users can access to explore how each of 13 different demographic groups relate to oil and gas wells across all US counties.


Case studies show the impact of overlapping demographics

For a long time now, EJ advocates have voiced the importance of taking a broader view of environmental stressors, and move beyond simply exploring outcomes for a single pollutant or population in isolation. In their seminal paper on this issue in 2011, UC Berkeley’s Rachel Morello-Frosch and her coauthors illustrate how critical it is to reframe our thinking around cumulative exposures and vulnerabilities, so that we may address environmental disparities.

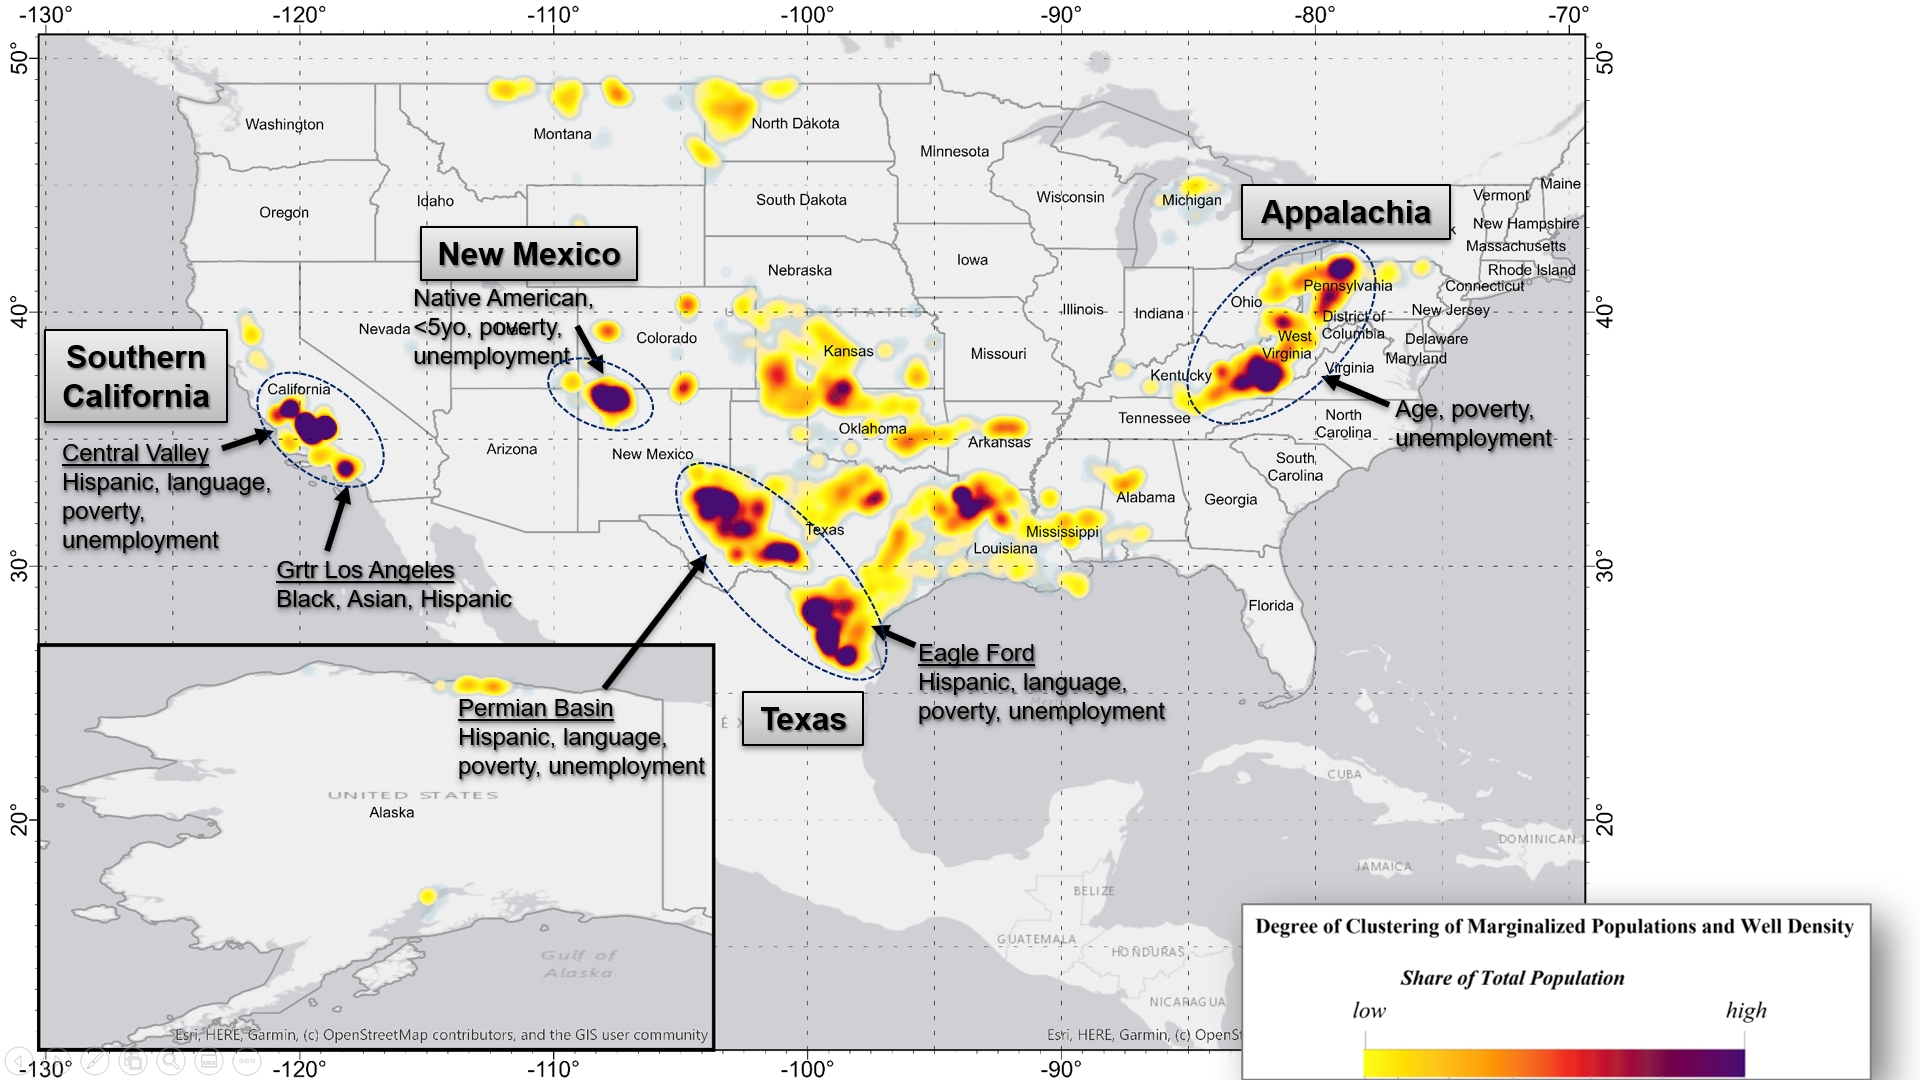
A central aspect of our paper is to embrace this view: we developed an index to highlight the places with substantial overlap of historically marginalized groups, and where we also found a high density of active wells. We found about 41 clusters of interest across the country, which are predominantly located in three specific regions: California, the Southwest, (San Juan, Eagle Ford and Permian Basins in Texas and New Mexico), and Appalachia. The main demographic characteristics represented in these are outlined in the map below:

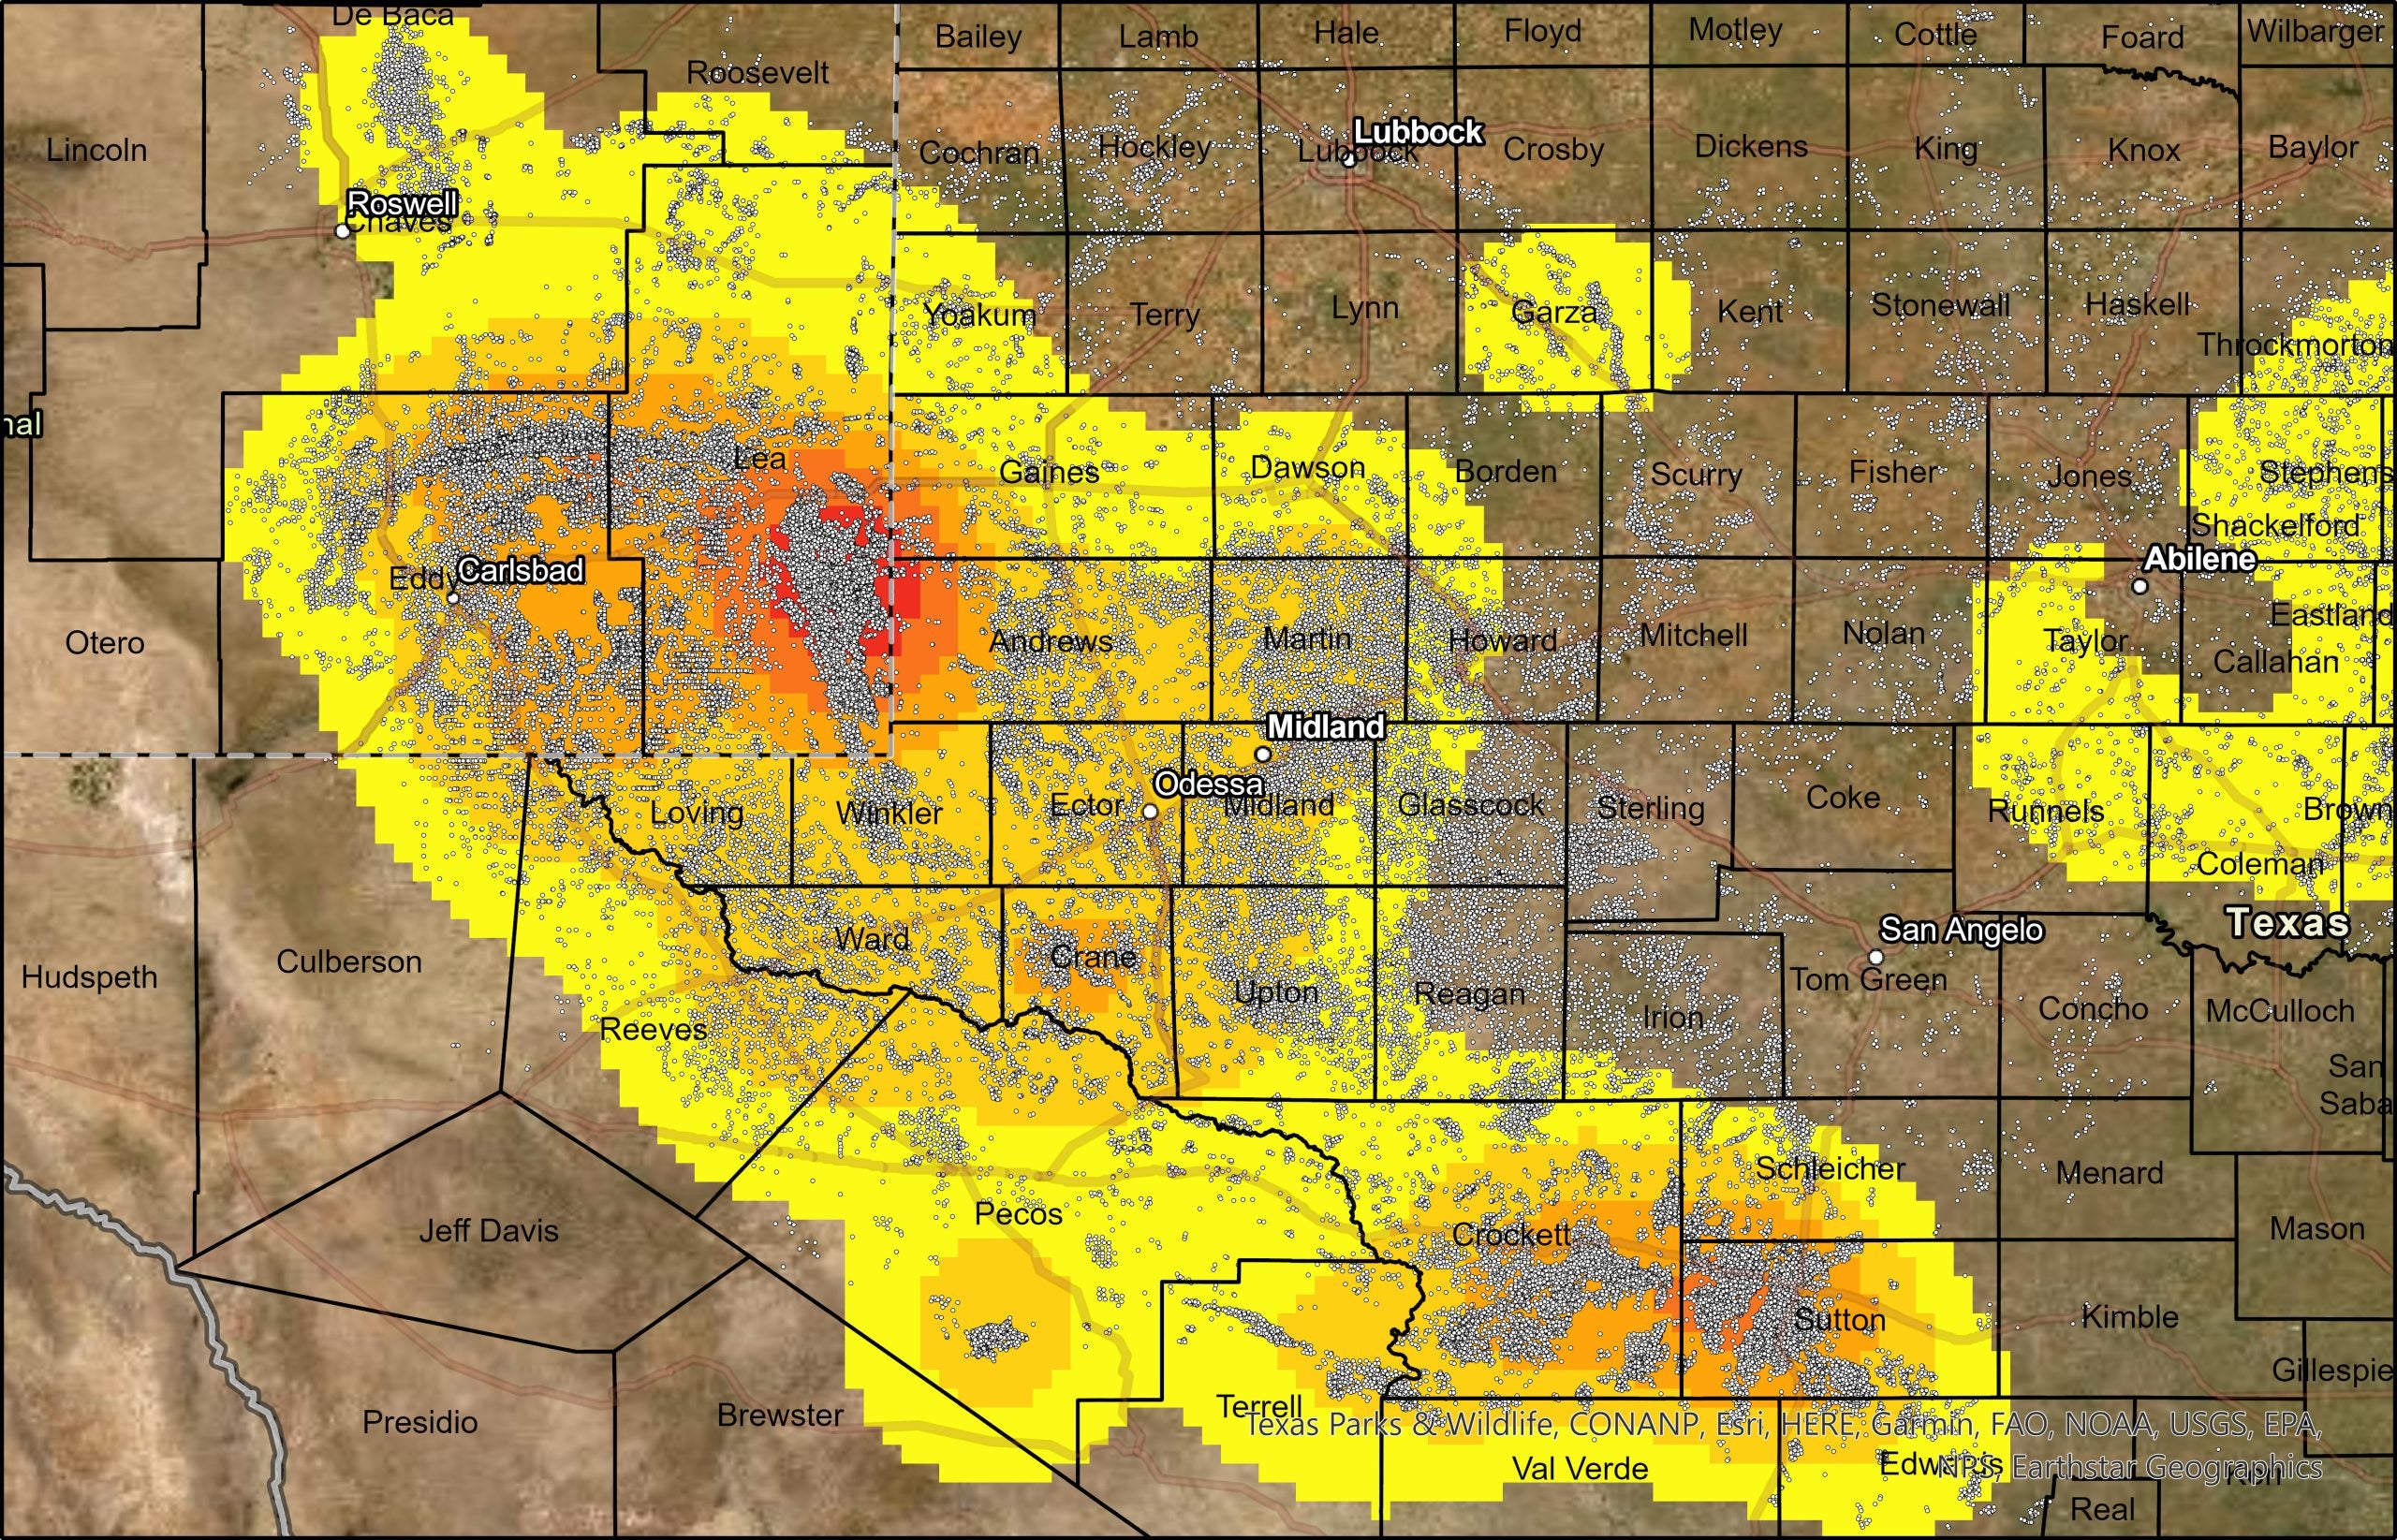
Taking a closer look at the Permian Basin (where EDF has conducted a methane monitoring initiative), one can clearly observe an abundance of active wells (the white dots). Certain counties here show a lot of overlap across historically marginalized groups, such as Lea and Eddy (in New Mexico), and Andrews, Crockett and Sutton (in Texas).

For example, in Lea county, Hispanics, children under 5, and unemployed individuals compose 59%, 9%, and 7% of the total population, respectively. Compare this to averages of 24%, 7%, and 4% across all counties across the US  where wells are found.


A basis for both current and future study

Users can explore the full data set, for all US counties, to learn more about the people living within 1, ½ , ¼, or 1/10th  of a mile of active oil and gas wells. This kind of information can be useful to a variety of organizations, like environmental justice and community groups to  highlight threats faced by people on the front lines, or health researchers, who can use this data to research projects delving into the health and other impacts associated with oil and gas operations.

It could also prove useful for policymakers concerned about the threats faced by their constituents, and to shape better policies.  For example, local, state and federal officials could use the data as they consider requirements designed to protect those who live in closer proximity to oil and gas wells, like more frequent leak inspections, appropriate setbacks, mitigation efforts to reduce light, noise and dust impacts, provision of information and services to populations in multiple languages, and the reduction of heavy truck traffic, as well as the elimination of high-polluting pneumatic devices and routine venting and flaring.

The new analysis comes as the EPA is considering new requirements to limit methane pollution from oil and gas wells across the U.S. Leading states including Colorado and New Mexico have established requirements in recent years that help protect frontline communities from oil and gas pollution including regular inspections at smaller wells with leak-prone equipment and bans on routine flaring. EPA will have the opportunity to build from these comprehensive approaches when it issues its supplemental rule proposal later this year.

Our methods used in the study can also be applied towards other environmental stressors. For example, EDF has used the same approach to explore communities living near large warehouses that attract polluting truck traffic, and other petrochemical facilities across the United States.

As you explore the interactive dashboard, let us know what you think. How can this data be made useful and supportive towards your own goals? Are there other ways it should be presented, or adapted so that it can be more effective? We’re happy to help you learn more about how you can make sense of it and what it means for your local community.  Please feel free to get in touch, and we hope to include your feedback in future versions of this tool and as we build out more population mapping efforts.

Posted in Uncategorized / Leave a comment

Barriers to tapping the potential of carbon markets for agriculture

An EDF analysis of carbon credits for rice growers shows great climate and cost-savings potential, but is that enough for farmers to participate?

In 2015, rice became the first crop for which agricultural carbon credits were valid for compliance in the California cap-and-trade system. Unfortunately, as of September 2020, no compliance credits have been generated. A newly released report by EDF explores the reasons why.

In the U.S., agricultural greenhouse gas emissions comprise approximately 10% of the economy-wide total emissions. The share of emissions from agriculture is larger for non-CO2 GHGs, making up approximately 78% of the U.S. total for nitrous oxide and 38% for methane.

Policymakers are eager to find mitigation opportunities in the agriculture sector, best evidenced by the bipartisan Growing Climate Solutions Act, which seeks to enable voluntary credit markets for producers to mitigate climate change.

As both policymakers and producers eye the potential of the agriculture sector to grow climate solutions, it’s worth taking a closer look at both the opportunities and the challenges that must first be addressed to tap this potential.

A case study of carbon credits for rice

EDF’s work on agricultural carbon credits began in earnest in 2007 after receiving the first of several U.S. Department of Agriculture grants to investigate how to bring agricultural emissions reduction credits to market. The objective was to design crediting systems that achieve the dual benefits of reducing GHG emissions while also providing meaningful revenue opportunities to landowners.

An EDF discussion paper summarizes some of the underlying analytics of these efforts for a series of crops and geographies. One specific example from the paper — rice in California — highlights both the carbon- and cost-saving opportunities associated with conservation practices like bailing and drainage, and the challenges associated with agricultural credits as a viable abatement measure.

The opportunity: Lowering costs and emissions

Rice is a GHG-intensive crop. It emits twice the amount of emissions per calorie as wheat, three times that of maize, and accounts for 5-20% of global methane emissions. EDF’s research focused on the nation’s two most intensive rice production regions — California’s Sacramento Valley and Mid-Southern U.S. These regions produce 26% and 72% of the domestic rice supply, respectively.

Our analysis began by using a biogeochemical model, DeNitrification-DeComposition (DNDC), to assess the abatement potential for current (baseline) practices and other lower-GHG alternatives in the California rice region. This led our scientists to discover a fairly large overall mitigation potential of more than 0.6 MMt-CO2e-100/year, or approximately 15%, of overall California rice emissions.

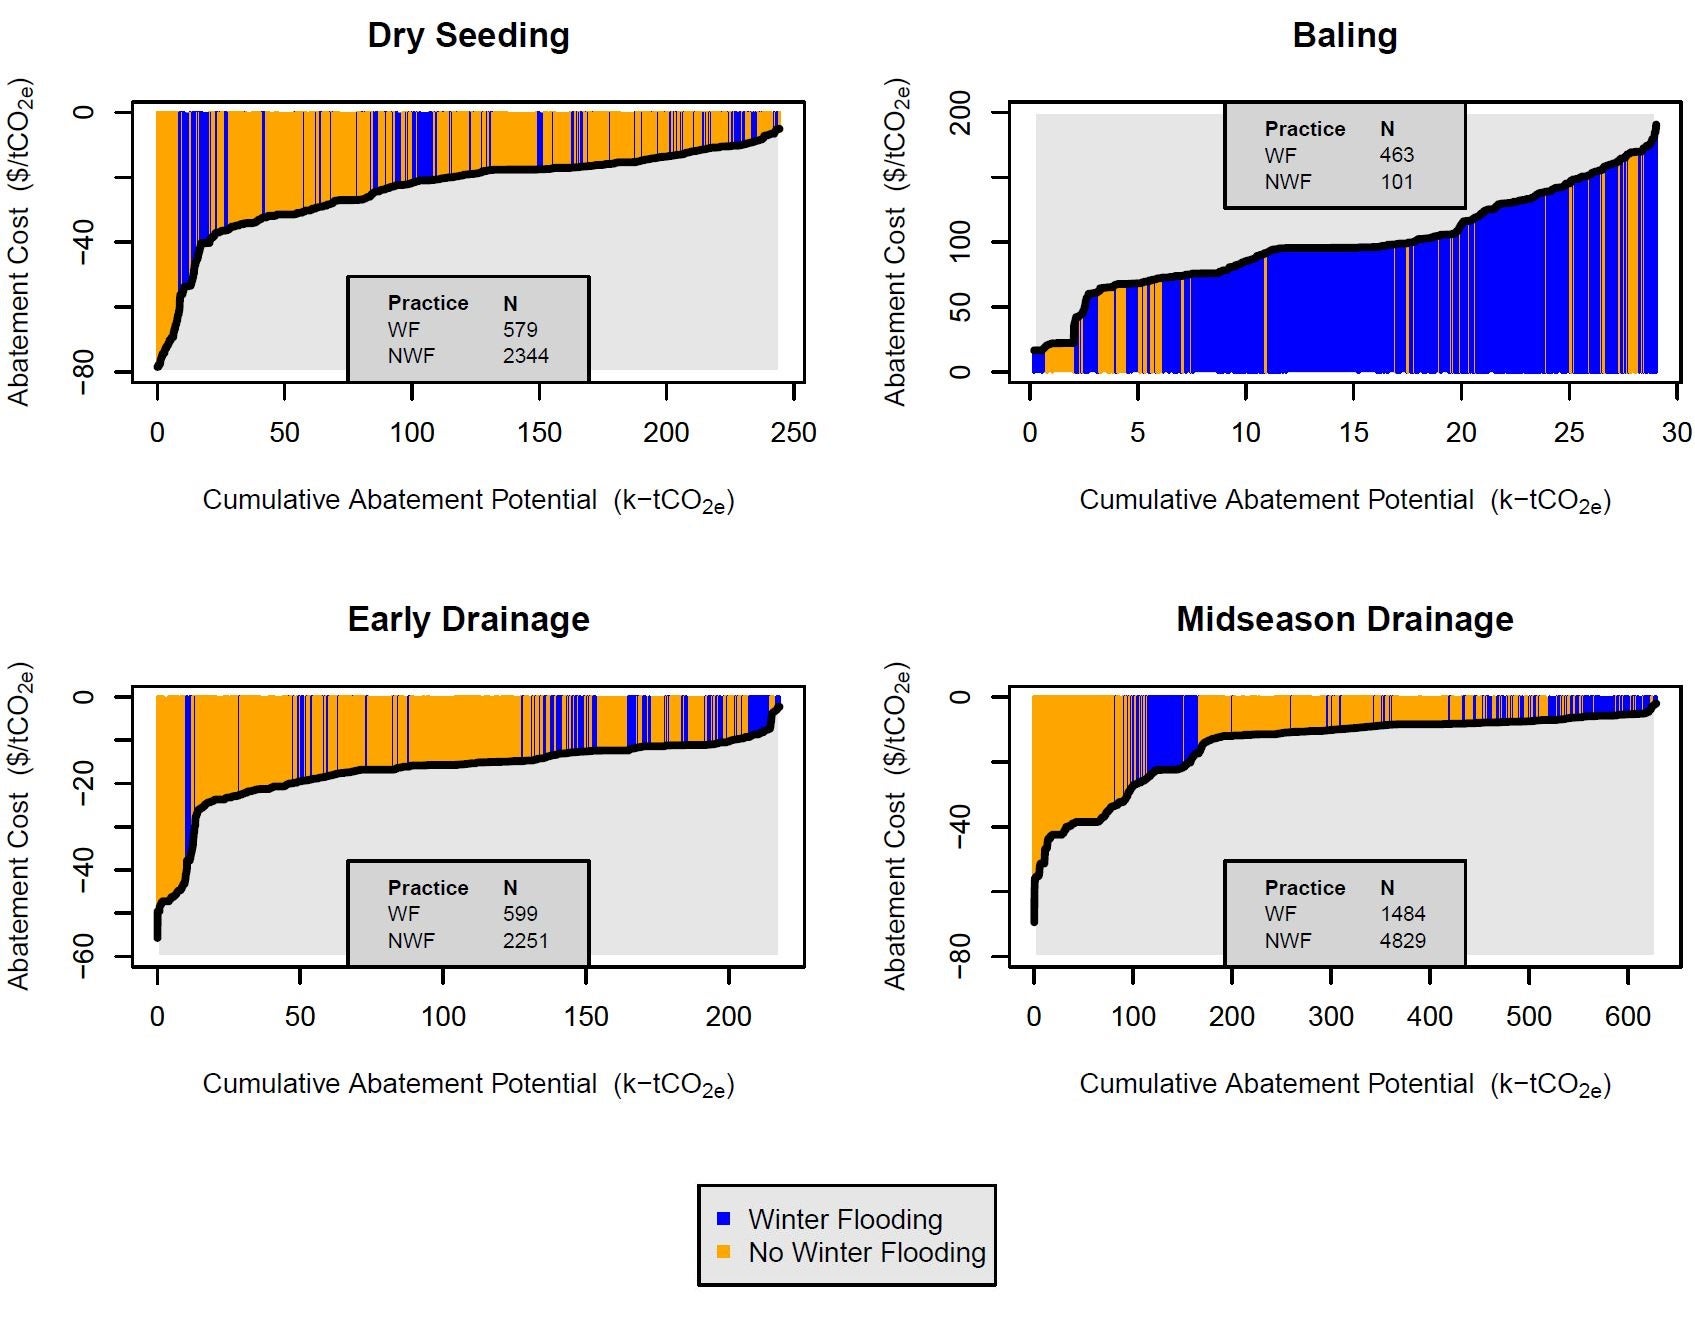
We then developed estimates of abatement costs by practice through cost budgets and consultation with agronomists. Combining this with the GHG modeling yielded the following marginal abatement cost curves (one for each practice).

Marginal Abatement Cost Curves for Rice Practices in California. Abbreviations: N (number of fields); WF (winter flooding of rice paddies); NWF (no winter flooding). WF/NWF practices follow a 60/40% distribution, historically, and play a role in determining the scale of achievable reductions.

These graphs illustrate that for all but one practice there are negative abatement costs with averages ranging from -$29.45/acre to -$0.45/acre, suggesting potential savings for farmers from implementing practice changes. For yields, the DNDC model projected that yields would remain relatively unchanged, aside from dry seeding, for which growers would experience an average 4.5% decrease.

These findings show great promise in terms of GHG abatement potential and cost savings for producers with minimal yield impacts (dry seeding aside). So, why aren’t growers already pursuing these practices? What barriers are getting in the way?

Three key barriers to entry

Our analysis identified a few potential barriers for farmers to generate carbon credits.

  1. Weak price signals

Understanding why growers are passing up potential cost savings from practices that reduce GHG emissions requires a closer look at farm economics. Adam Jaffe offers a useful typology for the various barriers to adoption, some of which I have identified below.

Putting the practice costs and yield impacts together, we can imagine a scenario where we have a carbon market in place and a carbon price of $10/ton (the California spot price at the time this work was carried out). In this instance, we’d find that with an average 0.7 ton/acre reduction, most rice growers would be looking at potential revenue from the market of approximately 0.5% of their overall crop sales revenue (typically $1,500/acre), or 2.6% of their net profit (approximately $250/acre), not including further potential gains from the negative abatement costs of certain practices and locations.

Unfortunately, in context of the overarching farm economics, this makes for a weak incentive.

If we now imagine a new scenario with a carbon price closer to today’s social cost of carbon ($42/ton), we find that the potential revenue from participating in the market rises closer to 2% of crop sales revenue and 11% of net profit. At this price, the incentive appears to be substantially more robust, which tells us that, from a social standpoint and with a strong price signal, the market could be viable. But as it currently stands, conditions are falling short of this potential.

  1. Large transaction costs

Another critical consideration for engaging in any market is transaction costs — for GHG markets in particular, monitoring, reporting and verification (MRV) costs.

Our analysis found transaction costs to be significant on a per-grower basis at approximately $14/acre for an average 1,000-acre California farm. At a market price of $10/ton, transaction costs are double the average expected return from carbon markets of $7/acre, providing a steep disincentive. Even with credits priced at the higher social cost of carbon ($42/ton), transaction costs would still equal nearly 50% of potential revenue, essentially cutting their expected financial gains in half.

Further economic modeling showed the importance of allowing a way to aggregate projects for MRV transations due to the very large third-party fees incurred to verify reductions. However, even if growers use aggregation as a means to cost-share, it will be critical to find ways to use technologies like remote sensing and automated data generation and analysis to streamline this process, realize savings and still guarantee accurate verification.

  1. Changing behavior is an obstacle in itself

Finally, behavioral factors represent a hurdle that cannot be ignored — the hidden additional cost of switching practices. This cost is difficult to quantify precisely, but we know from experience that behavior is hard to shift and farming practice changes typically require planning and close coordination with a number of consultants and business partners.

Understanding this, we performed a survey for corn and almond growers, asking how much participants in a carbon market would need to be paid to reduce fertilizer applications, and thereby decrease nitrous oxide emissions. To isolate the behavioral barriers, we designed the survey to encourage the farmers to assume no additional costs, risks or yield impacts.

Their responses ranged from $18-40/acre, when a representative farmer might only receive $7/acre in returns with a $10/t carbon price. This gap in the valuation likely represents factors such as personal or cultural values and aversion to risk and uncertainty that may be very difficult to overcome using market incentives alone[1].

Managing risk and risk perceptions is a challenge that must be addressed to see widespread uptake of mitigation practices.

Where do we go from here?

The agricultural sector has the potential to play a key role in contributing to national climate goals.

Crediting systems are just one tool to support this, but more research and pilot programs are needed to help overcome the barriers to entry, increase confidence in high-quality and cost-effective credits, and also evaluate and correct for potential inequities and injustices.

EDF is launching a new phase of research dedicated to this work, in addition to developing complementary finance and policy tools that correct for existing disincentives and inequities to create a more just and resilient food system.

With the right combination of tools in the toolbox, we can unleash the power of carbon markets to boost long-term resilience on the farm and beyond.


[1] It is important to note that all of the numbers depicted above represent averages, and there are certainly cases for which incentives are large at the individual level, and some growers may have zero or even negative switching costs, so many farmers have ripe potential for carbon market participation.


Posted in Cap and Trade, emissions, Uncategorized / Leave a comment

How the Suspension of EPA Regulations Fails to Recognize the COVID-19 Crisis and Social Costs

COVID-19’s burden on healthcare systems worldwide, a mounting death toll, and the impacts this has on people across the globe is truly alarming. In addition to the public health crisis, the pandemic has also brought most countries’ economies to their knees. Governments are making decisions today that will resonate for decades for future generations, which is why interventions must be intelligent and forward-looking, while practical, rapid and cost-effective. 

One of the macroeconomic aspects that has critical ramifications is determining what is deemed essential, in terms of jobs and services. Food, health care, and emergency services are clearly essential. And while policymakers can debate the merits of other positions, make no mistake, pollution monitoring and enforcement are also critical.

EPA’s Suspension of Enforcement

On March 26, EPA administrator Andrew Wheeler announced that the agency would suspend enforcement against violations of a broad set of environmental regulations, with no end date. This announcement effectively provides companies across the United States with a waiver from clean air and other public health protections, and has massive implications for human health at a time when keeping citizens healthy is paramount. We know air pollution causes diabetes, heart and lung diseases and worsens asthma, putting people at higher risk of severe effects of COVID-19. In fact, recent analyses find areas with high air pollution levels before this crisis reported higher COVID-19 death rates.

The naive expectation is that companies will continue to abide by the law and self-report any pollution amid the pandemic. This ignores well-established economics literature demonstrating how self-regulation does not work. Even if it is argued that reducing regulation will ease economic burdens at a time when it should be redirected for economic stimulus – that is also a fallacy that is undercut by the current administration’s analysis.

The Clear Benefits of Environmental Regulation

Every year, the Office of Management and Budget (OMB) performs a benefit-cost analysis (BCA) of all government agencies and federal rulings. The table below is taken from the most recent OMB report that did a thorough analysis and took a retrospective look over a 10 year period. [n.b, slated for release in 2017, this report was not made public until 2019. OMB only released one report during the Trump administration years, which was one-fifth of the length of previous ones, only did single-year BCAs, and was released two days before Christmas in 2019.]

Estimates of the Total Annual Benefits and Costs of Major Federal Rules (For Which Both Benefits and Costs Have Been Estimated) by Agency, October 1, 2006 – September 30, 2016 (billions of 2020 dollars). Sorted from best to worst Benefit-Cost Ratio, figures rounded to the nearest billion.

Agency# of RulesBenefitsCostsBenefit-Cost Ratio
2020$2020$
Environmental Protection Agency (EPA)39215 to 76250 to 61 4.3 to 12.6
Joint DOT and EPA449 to 8612 to 22 4.2 to 3.9
Department of Labor1011 to 303 to 7 3.6 to 4.2
Department of Health and Human Services187 to 352 to 7 3.1 to 5.0
Department of Energy2723 to 449 to 13 2.6 to 3.3
Department of Transportation (DOT)2725 to 459 to 17 2.6 to 2.6
Department of Justice32 to 51 to 1 2.1 to 4.0
Department of Agriculture51 to 21 to 1 1.2 to 1.4
Department of Homeland Security41 to 21 to 1 0.8 to 1.6

The table above underscores the crucial role EPA regulations play in human health and benefits to society. For each dollar spent on EPA’s programs, Americans derive a $4-13 benefit in the form of improved livelihoods. In general, rules exhibiting the greatest benefit-cost ratio relate to air pollutants, which have a great deal of interplay in terms of at-risk populations for COVID-19 and associated respiratory impacts. An EPA report focusing on the Clean Air Act amendments of 1990 finds a central estimate of a 32$ return for each dollar invested. Critically, these analyses do not monetize all of the health benefits of regulations, and thus these figures likely undercount the true benefits to society (the costs, however, are much more certain).

In terms of their benefit-cost ratio, EPA and major environmental rules result in benefits to the public that far outweigh their costs to government and industry. These rules are designed to preserve and protect human life and ecosystems. Removing protections presents a tremendous social cost.

Of course, EPA’s ability to enforce regulations during a pandemic has its limits. We wouldn’t want to put anyone at risk of contracting coronavirus. Still, there are ways to continue enforcement. EPA could redesign monitoring initiatives to continue digitally in places where this isn’t already the case. But announcing a sweeping, indefinite suspension that ignores most of what we know from behavioral economics and human nature makes little sense.

While the future is full of uncertainty, and economic turmoil is already here, we need to think carefully and critically about how to best protect people, the environment, and avoid slipping into a deep recession. Removing EPA’s ability to provide health protections to society during a public health crisis is lunacy. Doing it in the name of cutting costs is entirely misguided, as each dollar taken away results in an additional $4 to $13 in social costs.

Posted in Clean Air Act, Uncategorized / Leave a comment

What Night-time Lights Tell us about the World and its Inhabitants

Night viewMost people are familiar with the iconic image of North Korea at night—Pyongyang stands as a beacon of light amid of what looks almost like a large body of water—but what is, in fact, land draped in complete darkness. That imagery revealed details about what was previously unknowable due to the country’s cloak of secrecy—its meager electricity use and level of poverty. My colleagues Daniel Zavala-Araiza, Gernot Wagner and I took an even deeper look at how well night-time lights can account for other measures of socio-economic activity in a new article published today in the journal PLOS ONE.

I got interested in what these images could tell us back in 2012 when I started attending the Geo for Good conference, an annual event hosted by Google where nonprofits and researchers learn how to use geospatial tools such as Earth Engine. Gernot, Daniel and I started wondering what interesting applications we could explore with night-time lights data, and see what we could learn by examining the entire 21-year record of the National Oceanic and Atmospheric Administration’s Defense Meteorological Satellite Program (DMSP) at the country level. We took that dataset and compared it to a much wider scope of other datasets. By using a distributed, parallelized platform such as Earth Engine, the scope of this research and our analysis is able to be larger than prior studies.

The prevalence and magnitude of night-time light is an alternative, standardized, and relatively unbiased way to gather information about important socio-economic indicators like CO2 emissions, GDP, and other measures that would in some cases be unknowable. For example, these data helped estimate the size of the informal economy of Mexico in a 2009 study by Ghosh et al.

We’re hoping that by combining all of these methods, data sets, and tools, researchers can develop an even better understanding of how we relate to the environment, so we can ultimately become better stewards of it. Google Earth Engine, Hadoop and Spark are powerful examples of such tools —our hope is that our fellow researchers will ask and pursue new questions, so we can advance the conversation even further.

Posted in International, Technology, Uncategorized / Leave a comment