EDF Health

Mapping Lead: Powerful tool helps communities find underground hazards

Roya Alkafaji, Manager, Healthy Communities and Tom Neltner, Senior Director, Safer Chemicals Initiative

We have all come to expect access to information at our fingertips. To meet this demand, water utilities are increasingly posting interactive maps online to help residents identify whether their homes are connected to lead service lines (LSLs).[1] These are the pipes that deliver water from the main under the street to homes and buildings. In homes built before 1986, this pipe could be made of lead.

With this information, people can:

  • Better assess their risk of lead exposure from drinking water and take steps to reduce possible exposure (e.g., water filters);
  • Make decisions when renting or purchasing a new home, and/or;
  • Demand that their water utility and community invest in effective LSL replacement programs to reduce harmful exposure to lead, particularly for children who are most vulnerable.

Given the importance and growing popularity of LSL maps, we are launching a new blog series, Mapping Lead, that will explore how utilities are approaching maps, evaluate which map features are most and least effective, and share best practices to help guide future efforts.

EPA recognized the value of interactive maps in its August 2022 guidance on developing service line inventories. The agency recommended utilities of all sizes consider making information available through interactive maps using commonly available tools, like GIS software. The guidance references EDF’s 2019 study for evidence of the power of these interactive maps and spotlights LSL replacement programs in Cincinnati and Denver as examples of best practices.[2]

We wholeheartedly agree with EPA’s recommendations. As a result of the agency’s guidance, we anticipate that the number of online maps is likely to grow dramatically as utilities meet an October 2024 deadline to make their inventory of service line materials publicly accessible to comply with EPA’s revised Lead and Copper Rule (LCR).

Top 100 Cities: Who Has Maps – And Who Doesn’t

We identified over 50 interactive LSL maps that utilities have made publicly available to residents across the United States. Looking at the utilities that serve the 100 largest cities in the country, we found that 15 have LSL maps—a positive step that leverages existing asset-management tools such as GIS, while increasing public transparency. Together, these 15 utilities provide drinking water to more than 16 million people.

Throughout this blog series we’ll take a closer look at maps; in some cases, we’ll be critical of those that don’t meet the criteria for an effective map. Nonetheless, we recognize these utilities have taken a step in the right direction and should be applauded for their efforts.

We discovered that 12 large utilities were notably absent from the list of those with online maps. Given their size and location, these utilities presumably have LSLs in their distribution areas and the in-house resources to develop effective maps. We hope that by shining a light on the cities that are leading the way and addressing the contrast with those cities without maps, we can help spur action so residents of large cities served by these utilities will have access to this crucial information. For a list of the 12 utilities without maps and 15 with maps, see the tables below. We’ll continue to revise these lists as more large cities publish interactive maps online.

By the Numbers

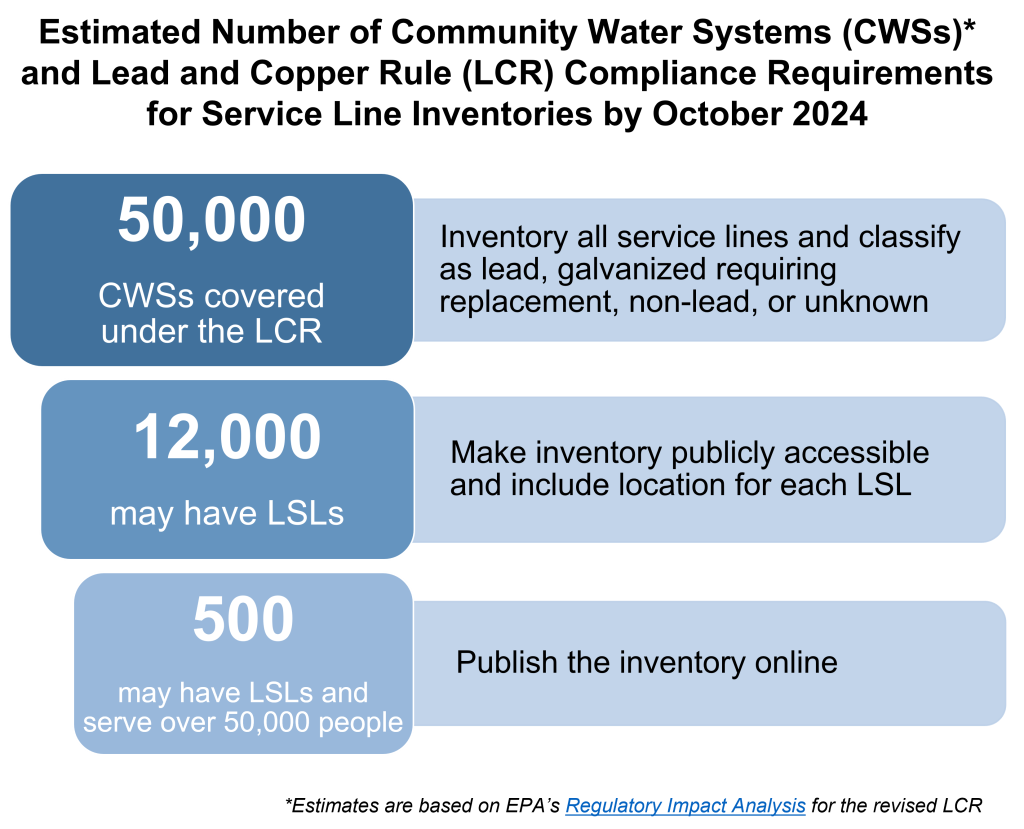
It’s important to understand the broader landscape as we track cities that are choosing interactive maps as a key tool for communicating about LSLs to the public. Using estimates from EPA’s Regulatory Impact Analysis for the revised LCR, the figure below shows the number of community water systems that fall under the purview of the LCR and subsequent requirements based on presence of LSLs and population served.

By October 2024, more than 50,000 utilities[3] will either submit an initial service line inventory or demonstrate the absence of LSLs in their distribution area.[4] EPA estimates that more than 12,000 utilities will find LSLs and thus will be required to make their inventory publicly accessible; those that serve over 50,000 people will also be required to post the inventory online.

More to Come

Follow along as we explore interactive maps and the role they play in LSL replacement.

Utilities Serving Top 100 Largest Cities With Online Interactive Maps

UtilityPopulation Served†Estimated # of LSLs‡
New York City, New York (Map)8.3 million360,000
Boston, Massachusetts (Map)2.6 million3,900**
Denver, Colorado (Map)1.4 million64,000**
Columbus, Ohio (Map)1.3 million28,000*
Seattle, Washington (Map)956,0002,000*
San Francisco, California (Map)884,0001,600*
Cincinnati, Ohio (Map)750,00040,000
Memphis, Tennessee (Map)700,00014,000*
Tucson, Arizona (Map)675,000600
Washington, D.C. (Map)632,00042,000**
Pittsburgh, Pennsylvania (Map)520,00016,000**
Toledo, Ohio (Map)480,00030,000**
St. Paul, Minnesota (Map)400,00027,000
Newark, New Jersey (Map)295,00024,000**
Jersey City, New Jersey (Map)262,00016,000
*Map and/or estimated number of LSLs reflects public side only.
**Active or completed LSL replacement program. The number listed reflects the estimated number of LSLs prior to the start of the program.
†Source is SDWIS, 2022.
‡Source available upon request.


Select Utilities Serving Top 100 Largest Cities That Lacked Online Interactive Maps

UtilityPopulation Served†Estimated # of LSLs‡
Chicago, Illinois2.7 million380,000
Baltimore, Maryland1.6 millionNot reported
Philadelphia, Pennsylvania1.6 million20,000
Cleveland, Ohio1.3 million200,000
Charlotte, North Carolina1.1 millionNot reported
Indianapolis, Indiana (Citizens Energy – Water)837,00055,000-75,000
Nashville, Tennessee722,000Unknown
Detroit, Michigan714,00080,000
Milwaukee, Wisconsin590,00066,000
Omaha, Nebraska554,00016,000-17,000
Minneapolis, Minnesota424,00049,000
New Orleans, Louisiana291,000Unknown
†Source is SDWIS, 2022.
‡Source available upon request.


[1] For this blog series, LSLs includes service lines that are “galvanized requiring replacement” per 40 CFR § 141.2.

[2] See Section 7.2 of EPA’s service line inventory guidance.

[3] For purposes of this blog series, community water suppliers as defined by EPA are referred to as utilities.

[4] Per 40 CFR 141.84(4), CWSs must categorize each service line, or portion of the service line where ownership is split, as lead, galvanized requiring replacement, non-lead, or lead status unknown. In order to declare that the system only contains non-lead service lines, this must be “determined through an evidence-based record, method, or technique.”


Revised May 2, 2023 to update blog series title and link.

Posted in Drinking water, Lead, Mapping Lead / Tagged , , , | Authors: / Comments are closed

EPA greenlights 21 states’ SRF plans to fund LSL replacement projects

Tom Neltner, Senior Director, Safer Chemicals

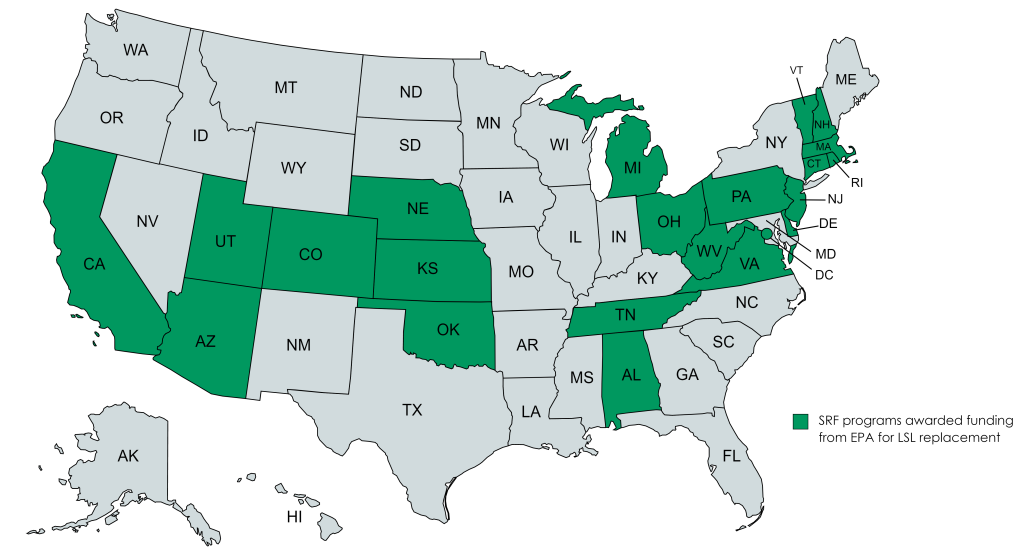
What’s New: EPA announced it has awarded $1.16 billion to the State Revolving Fund (SRF) programs in 21 states, the District of Columbia, and three territories to support lead service line (LSL) replacement projects. In order to secure funding, these states developed and submitted Intended Use Plans (IUPs), which included LSL replacement projects that met EPA’s requirements.

Why It Matters: These 25 programs can now begin distributing their share of the first of five years of funding from the $15 billion Congress included in the 2021 Infrastructure Investment and Jobs Act (IIJA) specifically for full LSL replacement projects. The remaining states are working to get their IUPs submitted to EPA.

Read More »

Posted in Drinking water, Lead, Public health / Tagged , , , , , , | Comments are closed

Anti-androgenic chemicals as a class of related substances with cumulative toxicological effects

Maricel Maffini, consultant, and Tom Neltner, Chemicals Policy Director

Scientists and regulators have known for decades that certain chemicals disrupt the actions of male hormones—identified collectively as androgens—in the body. Because of their effects, these chemicals are called anti-androgens or anti-androgenic chemicals.

During gestation, fetal testes begin producing testosterone, the critical hormone required to develop reproductive organs and genitalia. Insufficient production of testosterone leads to malformation of the genital tract that may need corrective surgery in infant boys and may result in reproductive health problems later in life. Ortho-phthalates (aka phthalates), known to interfere with the production of fetal testosterone, are considered anti-androgenic chemicals.

Although phthalates are perhaps the most recognizable group of anti-androgenic chemicals in the diet, there are others, including bisphenol A (BPA), propyl paraben, and certain pesticides used in food crops. Because they cause similar harmful effects, namely adverse health outcomes for male reproductive system, their safety assessment must take into account the cumulative effects of similar substances in the diet as established by law. But what does “cumulative effect” mean? Below, we use a recent study to explain what it means, why it is important, and why FDA is failing.

Biology is not math and the concept of something from nothing Read More »

Posted in Adverse health effects, FDA, Phthalates / Tagged , , , , | Authors: / Read 1 Response

EPA should ensure federal funds do not support harmful partial LSL replacements

Tom Neltner, Senior Director, Safer Chemicals Initiative and Roya Alkafaji, Manager, Healthy Communities

Last year, the White House set a goal of eliminating lead service lines (LSLs) by 2032 and worked with Congress to enact the Infrastructure Investment and Jobs Act (IIJA)—also known as the Bipartisan Infrastructure Law—which included critical resources to help meet this goal.

Through IIJA, communities across the United States have access to federal funds to replace an estimated 9 million LSLs, which are the pipes that connect homes to water mains under the street. EDF fully supports the President’s goal and related efforts to protect public health and advance environmental justice.

EPA is off to a good start. The agency:

  • Distributed the first of five years of IIJA funds to state revolving fund (SRF) programs, including $15 billion dedicated to LSL replacement and $11.7 billion in general funding for drinking water infrastructure projects (which may also be used for LSL replacement).
  • Provided guidance to states to help ensure the funds go to “disadvantaged communities” and that the $15 billion is used for full (not partial) replacements.
  • Plans to publish the results of its drinking water Infrastructure Needs Survey and Assessment. That report is crucial to updating the formula by which SRF funds will be allocated to states in subsequent years.

However, as states begin to administer SRF funds from the $11.7 billion in general infrastructure funding, EPA’s lack of clarity on what the funds can and cannot be used for reveals problems. Specifically, some states may allow this funding to pay for partial – as opposed to full – LSL replacements when a utility works on aging water mains that have LSLs attached to them.

Read More »

Posted in Civil rights, Drinking water, Health policy, Lead, Public health / Tagged , , , , , , , | Comments are closed

Unleaded Juice: FDA’s challenge of continuous improvement and compliance assurance

Tom Neltner, Senior Director, Safer Chemicals

This is the sixth in our Unleaded Juice blog series exploring how the Food and Drug Administration (FDA) sets limits for toxic elements like lead, arsenic, and cadmium in food and the implications for the agency’s Closer To Zero program. 

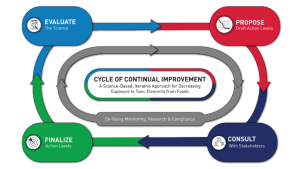
A core tenet of FDA’s Closer to Zero program is the “Cycle of Continuous Improvement” represented by the image below on the program’s webpage. The four-stage, outer ring represents FDA’s process for revising its action levels for food contaminants. The inner, grey ring describes the agency’s on-going monitoring, research, and compliance program.


This approach makes sense, and we fully support it. However, the success of this approach relies on FDA addressing several significant structural weaknesses.

  • Future funding is not guaranteed: In March 2022, Congress appropriated $11 million in Fiscal Year 2022 (FY22) funding for FDA’s maternal and infant health work—in part to support the agency’s efforts to reduce arsenic, lead, and cadmium in children’s foods. Last year’s request and appropriations were a significant increase over previous years, but that funding level is not guaranteed for future years.
  • Action levels are guidance—not legally binding requirements: FDA’s action levels for contaminants in food are established in guidance. The guidance introduction makes it clear that “The contents of this document do not have the force and effect of law and are not meant to bind the public in any way, unless specifically incorporated into a contract.” It assumes that the food industry—from the largest multinational corporation to the smallest entrepreneur—will comply.
  • The agency has limited means to monitor compliance: FDA largely relies on physical inspections and market sampling, supplemented by voluntary reporting, to assure compliance with action levels. Inspections at high-risk facilities must occur every three years (but likely have been delayed due to the COVID pandemic). We understand that most facilities will see an inspector once every eight years. This is particularly problematic because FDA says it lacks the authority to require food companies to provide requested documents without the physical inspection, and the agency does not require ongoing testing and reporting by companies for action levels.
  • Action levels must be consistently strong enough to drive research and impact markets: FDA correctly points to its success in setting an action level for inorganic arsenic in infant rice cereal as a model to lower contamination. Unfortunately, the model assumes the action level for a contaminant is set low enough to result in research investments and increased product and ingredient testing and to provide FDA with sufficient information to act on problems. This is not the case for lead in juice.
     
    We explore each of these weaknesses below.

Read More »

Posted in FDA, Food, Lead, Public health, Unleaded Juice / Tagged , , , , | Authors: / Comments are closed

ICYMI: EDF Cumulative Risk Assessment Framework Webinar

On Wednesday, September 7, 2022, Sarah Vogel, EDF’s Senior Vice President for Health, welcomed over 150 attendees to a webinar on EDF’s new Cumulative Risk Assessment Framework (CRAF). The event featured presentations by:

  • Lariah Edwards, PhD, EDF post-doctoral fellow and Associate Research Scientist, Department of Environmental Health Sciences, Mailman School of Public Health, Columbia University.
  • Devon Payne-Sturges, DrPh, Associate Professor, Maryland Institute for Applied Environmental Health, School of Public Health, University of Maryland.
  • Deborah Cory-Slechta, PhD, Professor of Environmental Medicine, Pediatrics, Public Health Sciences, and Neurosciences, University of Rochester Medical Center.

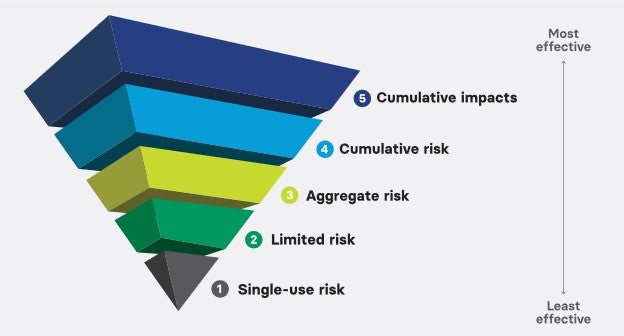
EDF staff developed this new tool to provide a practical pathway for applying comprehensive, cumulative chemical risk evaluations within the framework of the Toxic Substances Control Act (TSCA).

The tool is designed to support EPA’s mandate under TSCA to provide: 1) A holistic consideration of chemical risks, and 2) Special consideration of those who may be at greater risk because they are more susceptible to a chemical’s effects or more highly exposed.

The framework begins with the evaluation of a single chemical and moves toward an approach that takes into account multiple chemical exposures, as well as other, non-chemical stressors—like racism, poverty, and lack of access to health care. In combination, these factors lead to higher risks of disease and disability from cancers and heart disease to poor birth outcomes and childhood asthma.

For more information on the Framework, visit our new CRAF webpage, where you can download the in-depth report on the development of the framework and watch a recording of the webinar.

Posted in Health policy / Tagged , , , , , | Comments are closed