EDF Health

Selected tag(s): Lead

Unleaded Food: FDA acts quickly on contaminated cinnamon applesauce

What’s Happening?

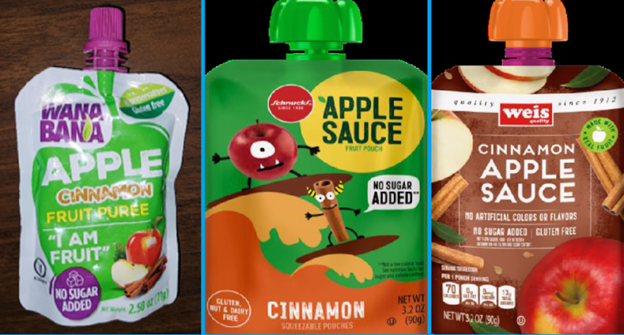
The North Carolina Departments of Health & Human Services and Agriculture & Consumer Services identified WanaBana cinnamon applesauce pouches as a source for elevated blood lead levels in multiple children. They found extraordinarily high concentrations of lead (1,900- 5,100 ppb) in the products, leading to the identification of at least 34 cases of elevated blood lead levels across 22 states to date.

On October 28, 2023, FDA issued a safety alert advising that “parents and caregivers of toddlers and young children who may have consumed WanaBana apple cinnamon fruit puree pouches should contact their child’s healthcare provider about getting a blood test.” Three days later, the company issued a voluntary recall.

As the recall expanded, FDA transferred the investigation to its Coordinated Outbreak Response & Evaluation (CORE) Network to determine the source of lead contamination and whether additional products are linked to illnesses.

Brands under a voluntary recall. Photo credit: FDA

Brands under a voluntary recall. Photo credit: FDA

Why It Matters

Lead levels in the puree ranged from 1,900 to 5,100 parts per billion (ppb). A single serving with 2,000 ppb exposed children to a lead level 64 times greater than FDA’s maximum daily intake of 2.2 micrograms/day (µg/day) for a child and 11 times greater than the 12.5 (µg/day) for an adult.

We will continue to note that there is no safe level of exposure to lead—making it toxic at any age, with heightened concern for children aged six and below. In homes without lead pipes or lead paint, diet is the primary source of lead exposure for young children. Read More »

Posted in Chemical exposure, FDA, Food, Health hazards, Public health / Also tagged , , | Authors: , / Read 1 Response

FDA says “Cookware that exhibits any level of leachable lead upon testing is prohibited.”

What’s New?

For the first time, FDA has provided guidance on how to evaluate whether metal cookware is prohibited due to lead leaching into food.

As part of an investigation to find the source of elevated blood lead levels in some refugee children, the Hazardous Waste Management Program in King County, Washington [1] encountered high lead levels in certain imported [2] aluminum cookware, including pressure cookers and pots & pans. The program attempted to bring this to FDA’s attention in late 2019, and submitted a formal product report to FDA in October 2021, after several attempts to contact an FDA representative directly.

In May 2022, the Program published a journal article about its findings; a year later, staff emailed FDA again seeking guidance. On June 1, 2023, FDA responded with a letter [PDF, 166KB] providing a method (see below) to evaluate lead in metal cookware. The agency also said:

  • “The marketing in interstate commerce, including importation, of cookware that exhibits any level of leachable lead upon testing is prohibited.”
  • “Neither lead nor lead-containing materials (e.g., metals, solder) are permitted under FDA regulations for use in contact with food.”
  • The Program should “feel free to share this letter or any of its contents with Amazon.com, Inc.,[3] and any other firms involved in the marketing or sale of cookware.”[4]

Read More »

Posted in FDA, Health hazards, Lead, Risk evaluation, Vulnerable populations / Also tagged , | Authors: / Comments are closed

Is it time to rethink “lead-safe” and “lead-free”?

By Tom Neltner, Senior Director, Safer Chemicals Initiative, Environmental Defense Fund and Charlotte Brody, National Director, Healthy Babies Bright Futures

Key Message

The scientific consensus is that there is no known safe level of lead exposure, and that no environment or home is truly free of lead.

With a few exceptions, we think it is time to retire the terms “lead-safe” and “lead-free” from our vocabulary. It sends conflicting messages to the public, consumers, and decision-makers. And it may undermine our efforts to reduce children’s exposure to lead from any source.

Rationale

Collectively, we have dedicated over a half-century to protecting children from lead. During that time, we and other advocates have used different terms to communicate our goals. Often, we drew our terms from the federal government. For example:

  • “Lead-free” has been used by Congress since 1986 to define drinking water pipes with no more than 80,000 parts per million (ppm) of lead. It kept the term in 2014 when it changed the level from 80,000 to 2,500 ppm. Similarly, FDA issued guidance in 2010 allowing a “lead-free” label on pottery if it meets the agency’s limits on lead.
  • “Lead-safe” is in the title for HUD’s 1999 rule to reduce lead-based paint exposure in federally assisted EPA also refers to “lead-safe work practices” in its 2008 renovation, repair and painting (RRP) rule for residential property. In addition, EPA created a “lead-safe” logo in 2010 for certified RRP firms. And HUD, EPA, and CPSC use the term in their pamphlet given to millions of families renting or buying homes built before 1978.

As a result, terms like “lead-safe” and “lead-free” have been commonly used to describe community-wide initiatives, label houses on maps, describe the state of a house after remediation, and much more.

What does lead-free mean? It depends on who you’re asking and what you’re asking about. A contractor may understand the term to mean that a house meets the EPA definition of not having a lead hazard, but does the average resident understand the term the same way? Is it accurate to describe a house as lead-free if there is still lead in the drinking water? Or in the spices in the cabinets?

Read More »

Posted in Contamination, FDA, Lead, Public health, Unleaded Juice / Also tagged , , , | Authors: / Read 2 Responses

Top 10 cities with the most lead pipes

Roya Alkafaji, Manager, Healthy Communities and Tom Neltner, Senior Director, Safer Chemicals Initiative

EDF identified 10 cities in the U.S. with the most lead service lines (LSLs) based on numbers reported in 2021.[1] These cities collectively have over one million LSLs, representing 12% of the 9.2 million EPA estimates are in the country.

Below we rank each city from most LSLs to fewest, and briefly describe the progress each city has made toward LSL replacement. Some have robust programs, while others have yet to start addressing the problem.

The List

1. Chicago, IL

Chicago Department of Water Management reported 387,095 LSLs in 2021, more than twice as many as the next city on this list. Three-quarters of its service lines are LSLs, and virtually all the rest are of unknown material. City ordinance actually mandated that LSLs be installed until the federal government banned them in 1986.

Decades later, Chicago is struggling to pull itself out of a deep hole relative to most other large cities that took earlier action against lead pipes. Chicago has a small LSL replacement program but applied for a $336 million loan from EPA in 2020[2] and $8 million in state revolving funds (SRF) from Illinois EPA in 2023 to accelerate the effort.

2. Cleveland, OH

Cleveland Water reported 185,409 LSLs in 2021, about 43% of all its service lines.

The utility has a small LSL replacement program but is seeking more than $63 million in federal infrastructure funding from Ohio EPA in 2023 to accelerate the effort.

3. New York, NY

New York City reported 137,542 LSLs in 2021 and an additional 230,870 lines that are of unknown material. About 43% of the city’s service lines are lead or of unknown material.

It has a small LSL replacement program and is seeking more than $58 million in federal infrastructure funding from New York State DEP in 2023 to accelerate the effort.

Read More »

Posted in Drinking water, Lead / Also tagged , , , | Authors: , / Comments are closed

Mapping Lead: Ohio issues map of properties with known lead hazards

Tom Neltner, Senior Director, Safer Chemicals Initiative, and Roya Alkafaji, Manager, Healthy Communities

What Happened: The Ohio Department of Health published an interactive map showing almost 1,200 properties whose owners have refused to comply with an order to correct known lead-based paint hazards. As a result, the Department has declared these properties are unsafe to live in until the hazards have been remediated.

Why It Matters: The availability of address-specific information is important to engage residents, potential home buyers, and renters so they can make better informed decisions about protecting their families from harmful lead exposure. Ohio is the second state after New Jersey that we’re aware of to move beyond neighborhood-level mapping of lead risks to provide specific information at the address level.

Read More »

Posted in Lead, Mapping Lead, Public health / Also tagged | Authors: / Comments are closed

Mapping Lead: New Jersey State map as a backbone for real progress on lead

Tom Neltner, Senior Director, Safer Chemicals Initiative and Roya Alkafaji, Manager, Healthy Communities

What Happened: The State of New Jersey published an interactive map showing potential sources of lead exposure for any given address in the state. Currently, the map specifically looks at lead-based paint in housing, though the State has plans to expand this to include other sources of lead, including drinking water from lead service lines (LSLs).

Why It Matters: The availability of address-specific information is important to engage residents, potential home buyers, and renters so they can make better informed decisions about protecting their families from harmful lead exposure. New Jersey is the first state to move beyond neighborhood-level mapping of lead risks to provide specific information about lead at the address level.

The map uses housing age as an indicator to assess risk to lead exposure, which is an excellent place to start because it is relevant to the prevalence of both lead-based paint and lead in drinking water.

As more information is added on lead pipes, lead-contaminated soil, and nearby commercial operations that release lead, as well as details on lead poisoning prevention requirements, the map will become a critical tool in the effort to comprehensively consider lead risks and drive exposure closer to zero.

Source: New Jersey Department of Environmental Protection Potential Lead Exposure Mapping (click on Lead-based paint tab at the top and zoom in until you see parcel-level detail with color overlays)

Read More »

Posted in Mapping Lead / Also tagged , , , | Authors: / Comments are closed