EDF Health

Biden Announces $3B to Replace Lead Pipes – More Money Going to States with Greatest Need

By Lindsay McCormick, Senior Manager, Safer Chemicals and Roya Alkafaji, Manager, Healthy Communities 

What’s New? 

President Biden recently announced $3 billion in federal funding for lead service line replacement. In the third year of this historic $15 billion investment through the Bipartisan Infrastructure Law to replace harmful lead pipes across the U.S., there is an effort to shift where the money is going to better reflect states’ needs. While many saw no or minimal change, others – like Texas, and Minnesota – saw major changes to their funding allotments. 

Why It Matters 

An estimated 9 million homes and businesses in the U.S. still receive their drinking water through harmful lead pipes. To make the best use of the federal funds aimed at protecting public health, it is critical that the money flows to the states with the greatest need, based on their estimated number of lead service lines without delay.  

EPA’s 7th Drinking Water Infrastructure Needs Survey and Assessment (DWINSA), which is the best current estimate of lead service lines across the nation, is the driver for FY23 and FY24 funding allotments. To best reflect the latest information, EPA allowed states and water utilities to submit a “one-time update” to service line information in the fall 2023, thus taking advantage of utilities’ ongoing efforts to inventory their service lines. The goal, which was partially achieved, was to more accurately allocate the funding based on need. 

What Changed 

EPA reported that 67% of water systems provided a response to the DWINSA update. While we do not know the magnitude of the changes to the state-level lead service line projections as EPA has not yet made this information public *, we do know how it has impacted the funding allotments. 

This year, Illinois received the most funding ($241 million), followed by Florida ($229 million), and Ohio ($184 million). Twenty-six states received the minimum allotment of $28.7 million. 

Funding allotment changes ranged from minimal to major: 

  • For 29 states, allotments remained the same or changes were minimal compared with last year.  
  • Fourteen states received more funding, with Minnesota having the greatest increase (128%). 
  • Nine received less funding, with Texas having the largest decrease (80%). 

We created a map to visualize the most impactful changes from the FY24 funding allotments, compared with FY23. 
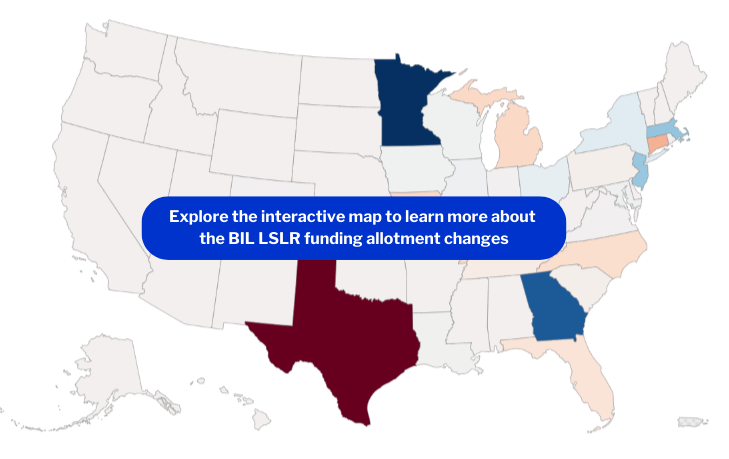
Interactive map helps users visualize the most impactful changes from the FY24 funding allotments, compared with FY23. 

Explore the interactive map to learn more about the BIL LSLR funding allotment changes

Our Take 

Last year, EDF analyzed the data behind the 7th DWINSA and found flaws in three major areas affecting Texas, New York and Florida. EPA’s fall 2023 one-time update to the DWINSA seems to have corrected two of the three issues we highlighted: 

  • Texas: Due to an apparent major data entry error in the original survey that inflated the state’s number of lead service lines, Texas received $146 million, the fifth largest allotment, in 2023. This year, the allotment decreased by 80% to $28.7 million. This freed up funds to be distributed to other states with greater need.  
  • New York: New York saw a 14% increase in its funding this year. New York City, home to over 100,000 lead service lines, did not participate in the original DWINSA, which we suspect dampened the state’s FY23 allotment by drastically underestimating the state’s total lead service lines. New York City’s lead service line estimate is reflected in the fall 2023 one-time update. We do not know with certainty whether New York’s increased FY24 funding can be attributed to New York City’s participation.  
  • Florida: Florida remained unwavering near the top of the list of states receiving the largest share of funding – over $228 million in FY24. We continue to question whether the state’s allotment matches the true need and are eager to understand how Florida has retained such a large share of the funding without clear evidence of the presence of lead service lines in the state. Large utilities, such as JEA (serving Jacksonville), are just beginning to inventory their lead service lines for the October 2024 Lead and Copper Rule deadline. We’ll keep an eye on the state’s Project Priority List to see how the money is being used.  

Next Steps 

When EPA released the initial DWINSA results in April 2023, we described how the new formula would positively impact funding allotments for lead service line replacement needs by state. It is now critical that EPA make the formula available for replication, as requested by State Revolving Fund administrators. This step would enable state policymakers and the public to better understand how funding decisions are made. EPA should also promptly release the state-level LSL projections from the one-time update, which drove the recent changes in funding amounts.  

EDF will continue to monitor how these resources are allocated to ensure these hard-fought funds go towards ensuring everyone has access to safer drinking water. Water utilities should aggressively pursue funding and start replacing lead service lines now while this historic funding is available. 

Go Deeper 

Read EPA’s press statement and memo on the funding allotments.  

*Updated 5/21/24: Since the publication of this blog, EPA published the state-level service line data from the updated DWINSA.

Posted in Lead / Authors: , / Comments are closed

Lead Pipes: EDF comments on EPA’s proposed Lead & Copper Rule Improvements

Graphic of lead service lines connected to homes

What’s New

Earlier this week EDF submitted comments that urged EPA to finalize the strongest possible improvements to the Lead and Copper Rule (LCRI). An estimated 9.2 million lead service lines (LSLs) are still connected to homes and buildings throughout the country. EPA’s proposal is a critical step to protect Americans from the harmful of effects of lead in drinking water by requiring LSL replacement.

Why It Matters

The EPA’s proposal, if finalized, would protect public health and yield huge socioeconomic benefits. This rule presents a critical opportunity to fix this longstanding environmental injustice. Read More »

Also posted in Drinking water, Environmental justice, Public health / Tagged , , , , , , , | Authors: / Comments are closed

Eliminating lead service lines yields huge benefits for reducing premature cardiovascular deaths

What’s New?

EPA has proposed improvements to the Lead and Copper Rule (LCR) to reduce lead in drinking water. The proposed rule would require utilities to eliminate the nation’s roughly 9.2 million lead service lines (LSLs) at an estimated cost of $2.1 to $2.9 billion per year.1

The socioeconomic benefits from the rule vastly outweigh the cost and range from $17.3 to $34.8 billion per year2 – a whopping 8 to 12 times the annual cost of replacement. Read More »

Also posted in Drinking water, Public health, Rules/Regulations / Tagged , , , , , , , | Authors: / Comments are closed

FDA says “Cookware that exhibits any level of leachable lead upon testing is prohibited.”

What’s New?

For the first time, FDA has provided guidance on how to evaluate whether metal cookware is prohibited due to lead leaching into food.

As part of an investigation to find the source of elevated blood lead levels in some refugee children, the Hazardous Waste Management Program in King County, Washington [1] encountered high lead levels in certain imported [2] aluminum cookware, including pressure cookers and pots & pans. The program attempted to bring this to FDA’s attention in late 2019, and submitted a formal product report to FDA in October 2021, after several attempts to contact an FDA representative directly.

In May 2022, the Program published a journal article about its findings; a year later, staff emailed FDA again seeking guidance. On June 1, 2023, FDA responded with a letter [PDF, 166KB] providing a method (see below) to evaluate lead in metal cookware. The agency also said:

  • “The marketing in interstate commerce, including importation, of cookware that exhibits any level of leachable lead upon testing is prohibited.”
  • “Neither lead nor lead-containing materials (e.g., metals, solder) are permitted under FDA regulations for use in contact with food.”
  • The Program should “feel free to share this letter or any of its contents with Amazon.com, Inc.,[3] and any other firms involved in the marketing or sale of cookware.”[4]

Read More »

Also posted in FDA, Health hazards, Risk evaluation, Vulnerable populations / Tagged , , | Authors: / Comments are closed

Is it time to rethink “lead-safe” and “lead-free”?

By Tom Neltner, Senior Director, Safer Chemicals Initiative, Environmental Defense Fund and Charlotte Brody, National Director, Healthy Babies Bright Futures

Key Message

The scientific consensus is that there is no known safe level of lead exposure, and that no environment or home is truly free of lead.

With a few exceptions, we think it is time to retire the terms “lead-safe” and “lead-free” from our vocabulary. It sends conflicting messages to the public, consumers, and decision-makers. And it may undermine our efforts to reduce children’s exposure to lead from any source.

Rationale

Collectively, we have dedicated over a half-century to protecting children from lead. During that time, we and other advocates have used different terms to communicate our goals. Often, we drew our terms from the federal government. For example:

  • “Lead-free” has been used by Congress since 1986 to define drinking water pipes with no more than 80,000 parts per million (ppm) of lead. It kept the term in 2014 when it changed the level from 80,000 to 2,500 ppm. Similarly, FDA issued guidance in 2010 allowing a “lead-free” label on pottery if it meets the agency’s limits on lead.
  • “Lead-safe” is in the title for HUD’s 1999 rule to reduce lead-based paint exposure in federally assisted EPA also refers to “lead-safe work practices” in its 2008 renovation, repair and painting (RRP) rule for residential property. In addition, EPA created a “lead-safe” logo in 2010 for certified RRP firms. And HUD, EPA, and CPSC use the term in their pamphlet given to millions of families renting or buying homes built before 1978.

As a result, terms like “lead-safe” and “lead-free” have been commonly used to describe community-wide initiatives, label houses on maps, describe the state of a house after remediation, and much more.

What does lead-free mean? It depends on who you’re asking and what you’re asking about. A contractor may understand the term to mean that a house meets the EPA definition of not having a lead hazard, but does the average resident understand the term the same way? Is it accurate to describe a house as lead-free if there is still lead in the drinking water? Or in the spices in the cabinets?

Read More »

Also posted in Contamination, FDA, Public health, Unleaded Juice / Tagged , , , , | Authors: / Read 2 Responses

Flaws found in EPA’s lead pipe survey of states and water utilities

Deep Dive: Read our Deep Dives blog for an in-depth analysis on the data that drove the 2023 allocation of federal funding for lead service line replacements.

What’s New: EPA recently estimated there are 9.2 million lead service lines (LSLs) in the nation’s drinking water infrastructure based on information reported by states and water utilities. This was collected as part of a survey conducted every four years to understand drinking water infrastructure needs.

The agency estimated the number of LSLs for each state. Two had surprisingly high numbers: Florida with 1.2 million LSLs and Texas with 650,000.

After reviewing data EPA used to estimate each state’s totals[1], we believe that these two may have less than 100,000 LSLs each. If true, this means the country may actually have about 1.6 million fewer LSLs than originally thought – good news overall.

Read More »

Also posted in Deep Dives, Drinking water / Tagged , , , , | Authors: , / Comments are closed