New study: Using interactive online tools to publicize lead service line locations and promote replacement
Written By

Share
By Sofia Hiltner, Rainer Romero, Lindsay McCormick and Tom Neltner
[pullquote]
EDF study evaluates interactive online tools in three Ohio cities that help users know which addresses have a lead service line.
[/pullquote]
In 2016, EPA called upon states to work with drinking water utilities to make publicly available the location of lead service lines (LSLs, the lead pipes that connect the main under the street to buildings) via maps or other mechanisms. Ohio led the way with legislation requiring more than 1,800 utilities to submit static PDF maps that showed where LSLs were likely to be present and then posting the maps online. Three cities in the state took the effort a step further to communicate the information to their customers by posting online tools. In 2016, Cincinnati posted an interactive map of LSLs modeled after one posted by Washington, DC earlier that year. The next year, Columbus posted an interactive map and Cleveland posted a search engine enabling anyone to check the service line material at an address.
Interactive maps
The interactive map approach has become popular for displaying LSL locations. By our count, 16 communities in eight states now have them available online, with Illinois leading the way with six interactive maps – thanks to encouragement from the state. Every interactive map includes what is known or not known about the portion of the LSL on public property (commonly known as public- or city-side). However, only a few maps address the portion of the service line on private property (private-side). The maps also vary significantly in the icons they use, how they present what is unknown, and whether they encourage customers to provide information to update the map by submitting photos showing whether the service line is lead.
Interactive maps enable users to not only search a specific address but also quickly survey a neighborhood. In addition, people are familiar with them from our everyday life. However, users can easily misunderstand them by jumping right into the map, skipping through disclaimers that alert users of critical limitations and make assumptions about the meaning of the icons. Therefore, it is crucial that they are well-designed and user-tested.
EDF’s study
Given the diverse approaches taken to display LSL locations, EDF decided to conduct a study evaluating the online tools from three Ohio cities – Cleveland, Cincinnati, and Columbus – as examples to determine what features were most effective in prompting potential homebuyers or renters to replace the LSL, yet not become paralyzed by the health threat it poses. This effort involved a collaboration of EDF’s behavioral scientists (Rainer Romero and Sofia Hiltner) and its health program (Lindsay McCormick and Tom Neltner).
Today, AWWA Water Science published the peer-reviewed study. EDF’s key takeaways from the study are:
- Online tools, including interactive maps and simple search engines, that allow anyone to search a specific address are an important way for communities to engage residents in accelerating LSL replacement, especially when searching for a new home to buy or rent.
- When users discover that a property they wish to move into may have an LSL from an online tool, they overwhelmingly indicated they would be likely to pressure the seller to replace the LSL as a condition of purchase. Only 5% of survey participants said they would consider moving into a home without taking some action.
- Users want information about both the city-side and private-side of the service line and may be frustrated when they learn a tool only provides information about one side.
How did we design our study?
In order to assess the comprehensibility of each tool, we surveyed 795 potential homebuyers and renters who currently live or have lived in Ohio. We chose this population because they could relate to the communities and were familiar with the homebuying or renting process.
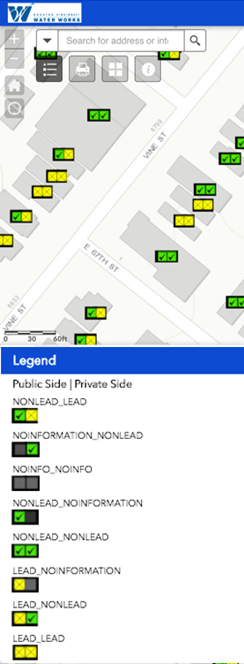
All participants viewed the Cleveland Static Map at the beginning and the Cleveland Interactive Database (a search engine with no map feature) at the end. Half saw the Cincinnati Interactive Map and half saw the Columbus Interactive Map in between. We note that the survey could not test interactive features of these maps and instead used static images (like those pictured here). After viewing each tool, each participant responded to questions intended to assess whether they understood the information presented (i.e. whether an LSL was present on an individual property or in an area).
The survey also directed respondents to put themselves in the mindset of a potential homebuyer or renter who wished to move into a specific home. Next, they were informed whether an LSL was present or its status was unknown in the home. In each scenario, the survey asked them to select their likelihood of taking a specific action to replace the LSL or otherwise avoid lead exposure. Respondents were asked how likely they were to:
- Insist that the owner confirm LSL-status.
- Insist that the owner replace LSL as condition of purchase or rental.
- Look for another home to buy or rent.
- Move in and pay for LSL replacement (home sale condition only).
- Move in, leave the LSL in place, and install a filter (renter condition only).
- Move in and leave the LSL in place.
What did we find?
When asked which actions they would take if they (hypothetically) learned there was an LSL on a property that they wished to move into, participants overwhelmingly said that they would be likely to take action to either remove the LSL, or avoid it by looking for another home to move into. In fact, we saw that our respondents expressed greater willingness to take action on LSLs at home than respondents in studies where we asked about likelihood of taking action on other environmental issues (i.e., calling a state representative or city official about air quality issues or about the need for leak detection and repair in the natural gas distribution systems in cities). See the table below for our findings across the three interactive tools assessed.
Table: Likelihood of performing action in response to LSL-status*
| Insist owner to confirm LSL-status | Insist owner replace LSL as condition of purchase or rental | Look for another home | Move in & pay for LSL replacement | Move in & leave LSL alone | |
|---|---|---|---|---|---|
| Lead is present in either side of service line | -- | 85-91% | 81-88% | 33% | 4-6% |
| Lead status is unknown | 88-90% | -- | 55-65% | -- | -- |
| *Ranges are derived from various conditions. See the full article for more precise results. | |||||
Further, only one in four of potential renters indicated they would be likely to install a filter and replace it monthly at a loss of about $150 a year (only queried after viewing the Cleveland Interactive Database), demonstrating instead a preference to insist the landlord replace the LSL as a condition of rental or look for another home to rent.
Overall, the participants demonstrated the greatest understanding of the Cincinnati Interactive Map, which provided information about both the public and private-side of service lines at individual properties. Respondents were more likely to correctly report the LSL-status of a property on this map than when viewing the other tools. (See figure below for more information).
Figure: Comprehension of whether a tool presented information about the public or private side of the service line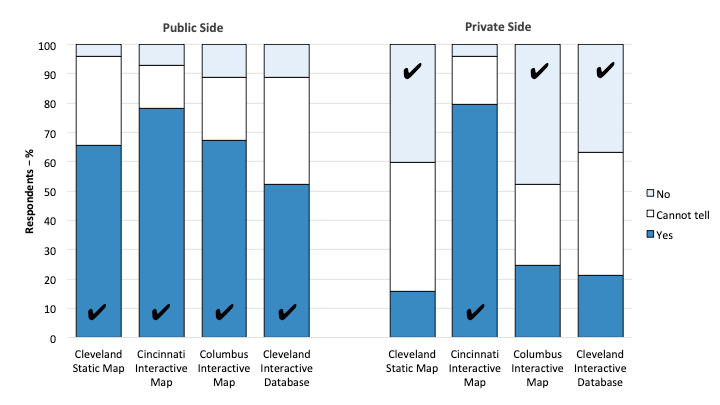
While the Cincinnati Interactive Map was the preferred tool among those who viewed it, we found that those participants who instead viewed the Columbus interactive map preferred Cleveland’s Interactive Database. We think this could be because the Columbus Interactive Map had confusing legends and did not make as clear as the Cleveland Interactive Database that it did not include information on the private side. Note, however, that we specifically selected the Cleveland Interactive Database because it allows any user to view information on specific addresses, while most similar searchable databases are not readily usable by the public because they require a customer account number or phone number to access address-specific information.
Recommendations
What should communities consider when developing their own interactive tools?
Based on our findings, we provided the following recommendations for those looking to develop or improve interactive tools that provide information about LSLs. Please read the full article to see all of our recommendations described in detail.
- Provide information about individual properties. Prospective home buyers and renters want to determine whether the property they are interested in may have an LSL. Furthermore, if a property owner replaces an LSL, a tool that does not provide property-level information will not reflect this action, potentially lessening the incentive for property owners to replace LSLs.
- Provide information on the private side, in addition to the public side, of the service line. If the tool only provides information about the public-side, users may not be aware that the service line includes a private side as well. Further, if they later learn that the private-side is not included, they will be frustrated. We recommend that if a tool only provides information for the public side, it should be made very clear that 1) it refers to the public side, and 2) that a private side also exists. Beyond creating potential confusion, the absence of this information may also lessen the incentive for property owners to replace their private side LSLs.
- Be explicit about what is not known. Our results demonstrate that participants found it useful to be informed if the service line material is unknown — and did not appear to be confused by such information. The most transparent approach is to explicitly indicate if service line material is unknown and update the map over time, as applicable.
-
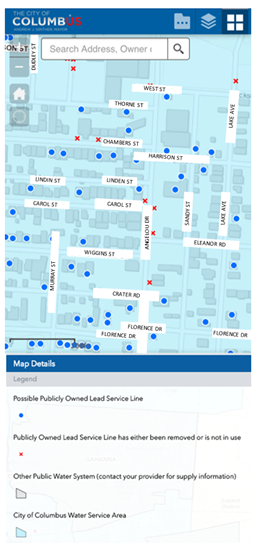
Columbus Interactive Map, courtesy of Columbus Water Carefully consider legends, colors, and icons. These features of a map can dramatically impact a user’s understanding of a map, and their subsequent behavior. For example, while we did not design the study in such a way to determine its impact definitively, we hypothesize that the use of a red X (which may have a negative connotation) in the Columbus interactive map (to the right) to denote that the LSL has been removed or is not in use (i.e., not lead), may have been the driver of lower comprehension we found for this particular map. See this ESIR presentation on best practices for map design as well as Color Brewer to test out map colors.
Complementing interactive maps with other communication and disclosure requirements
Communities cannot rely solely on interactive maps or tools to communicate the locations of LSLs. For example, only 3.7% of our Ohio-based sample surveyed had previously heard about these types of online tools. Further, some users will inevitably misunderstand the tools. It is therefore critical not only to further advertise such tools to the public, but to reinforce this message through other communications, such as direct mailings and phone calls to property owners.
Another way of ensuring that prospective homebuyers and renters are aware of LSLs is by requiring the disclosure of the presence of an LSL during home sale and rental. While there is no federal requirement, currently seven states and Washington, DC require sellers to disclosure the presence of lead in plumbing to prospective homebuyers – and three cities (Cincinnati, Philadelphia, and now Washington, DC) require landlords to disclosure the presence of LSLs to tenants. Beyond these disclosure requirements, prospective buyers may also hire home inspectors to conduct a physical inspection for the presence of an LSL. Our team conducted a second study with a national sample in order to assess how potential homebuyers and renters would respond to the disclosure of such information when buying or renting a home. Stay tuned for further details.
Summary
Interactive online mapping and database tools with address-specific information on LSLs are a useful, although imperfect, way to effectively communicate to the public. Regardless of the tool used, providing people with information about the risks posed by the presence of LSLs is important. The widespread use of these tools should also provide an incentive for property owners to replace the LSLs when selling or renting property.