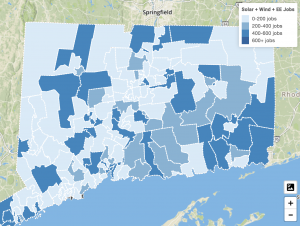
New interactive map shows the economic impact that solar, wind, and energy efficiency have on U.S. communities
Written By
Share
 The benefits of clean energy reach far beyond protecting the environment. Investments in the U.S. clean energy sector are creating millions of jobs and supporting local communities across the country. A new online mapping tool will help illustrate this incredible progress.
Developed by San Francisco-based Kevala Analytics Inc., the U.S. Clean Energy Progress Map can display the number of solar, wind, and energy efficiency jobs by state, county, congressional district, and even census tract. The free, interactive map also shows wind and solar projects and investments. It’s exactly the kind of data that citizens need to show policymakers and local officials the economic benefits of clean energy in their state or district.
[Tweet “NEW interactive map shows the economic impact that solar, wind, and energy efficiency have on U.S. communities #CleanEnergyProgress”]
A comprehensive, user-friendly tool
What’s unique about this tool is that it allows users to drill down into hyperlocal data to see how solar, wind, and energy efficiency are touching their local economy. It’s also user-friendly, so you don’t have to be a data scientist or policy wonk to use it.
At the same time, the map consolidates government and industry data about the clean energy sector, which makes it a singular, dynamic resource for analyzing the economic impact of wind, solar, and energy efficiency jobs across geographic regions, census tracts and voting districts.
Focused on economic data
Here are a few examples of the map’s compelling data:
- In East Texas, there are more than 3,000 solar and energy efficiency jobs combined in state congressional voting district 1, and every single census tract in that district has at least one solar installation (most tracts in that district have more).
- West Virginia, one of the most coal-heavy states in the U.S., there are more than 21,000 wind, solar, and energy efficiency jobs.
- In Arizona, there are more than 47,000 wind, solar, and energy efficiency jobs and nearly 3 GW of installed wind and solar, which is enough to power more than a half a million homes.
Currently, the map includes wind, solar, and energy efficiency-related figures. But Kevala hopes to broaden its database to include more data, like energy storage installations and electric vehicles.
As it stands today, however, Kevala’s tool has the potential to be incredibly powerful.
In 2018, state and federal policymakers will face legislative decisions that could impact the competitiveness of clean energy significantly. Fake news contributes to voter skepticism about information sources. Providing Americans with impartial facts about the economic impact of emerging clean industries is critical to both the democratic process, as it enables informed decision-making, and to public health.