Monthly Archives: March 2008

News from the Antarctic

James WangThis post is by James Wang, Ph.D., a climate scientist at Environmental Defense Fund.

This month, while Arctic sea ice hits its annual wintertime high (such as it is – see last week’s post), Antarctic sea ice reaches its summertime low.

We’ve already posted about the British Antarctic Survey’s report of a vast ice berg on the verge of breaking off the Wilkins Ice Shelf. Here’s more on what’s happening at the South Pole from NASA’s recent briefing on polar sea ice.

Read More »

Posted in Arctic & Antarctic / Comments are closed

Carbon Tax Doesn’t Always Lower Emissions

Sheryl CanterThis post is by Sheryl Canter, an Online Writer and Editorial Manager at Environmental Defense Fund.

Here’s the quote of the week, from a New York Times Op-Ed piece:

Denmark, Finland, Norway and Sweden have had carbon taxes in place since the 1990s, but the tax has not led to large declines in emissions in most of these countries – in the case of Norway, emissions have actually increased by 43 percent per capita.

This observation reinforces what we’ve been saying all along about why a carbon tax isn’t the right approach. A tax doesn’t guarantee lower emissions; a cap does.

Posted in What Others are Saying / Read 8 Responses

Arctic Sea Ice a Thin "Façade"

James WangThis post is by James Wang, Ph.D., a climate scientist at Environmental Defense Fund.

Last summer we saw record-shattering shrinkage of Arctic sea ice caused, in part, by human-induced global warming. Last week I listened in on a NASA briefing on polar sea ice, and this year looks no better.

This winter was relatively cold due to a strong La Niña, so the Arctic saw a modest increase in overall sea ice (slightly above the record low of 2005-2006, but still below the long-term average). However, the older, thicker ice that lasts through the summer has declined sharply, and this is very worrying.

Read More »

Posted in Arctic & Antarctic / Read 6 Responses

Bottles, Bottles, Everywhere…

Ramon CruzThis post is by Ramon Cruz, Senior Policy Analyst for Living Cities at Environmental Defense Fund.

It’s ironic. In many parts of the world, there is no clean drinking water. Here in the U.S., pure, drinkable water flows out of every tap, and yet Americans buy a staggering amount of bottled water. We pay big bucks for it, too – over $15 billion a year.

Worse of all, the bottles are overflowing our landfills, and contribute to global warming. Take a look at this video from Doug James, and then check out these surprising facts.

[kml_flashembed movie="http://www.youtube.com/v/OZbTXDkrD1o" width="425" height="350" wmode="transparent" /]

Read More »

Posted in News / Read 11 Responses

Antarctic Ice Shelf Hanging by a Thread

Sheryl CanterThis post is by Sheryl Canter, an Online Writer and Editorial Manager at Environmental Defense Fund.

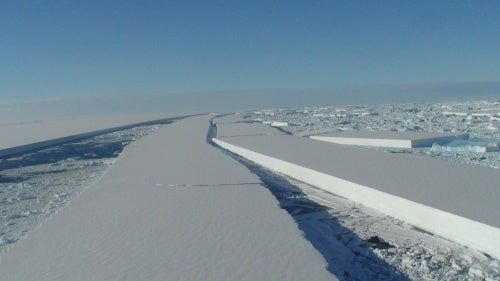
A huge Antarctic ice berg – seven times the size of Manhattan – is close to breaking off, supported only by a thin strip of ice hanging between two islands.

Part of the Wilkins Ice Shelf, the berg was captured in satellite and video images by British Antarctic Survey (BAS), which said, “It is another identifiable impact of climate change on the Antarctic environment.”

Wilkins Ice Shelf from Bas Twin Otter

Posted in Arctic & Antarctic / Read 5 Responses

Short-Term Cooling from La Niña

Lisa MooreThis post is by Lisa Moore, Ph.D., a scientist in the Climate and Air program at Environmental Defense Fund.

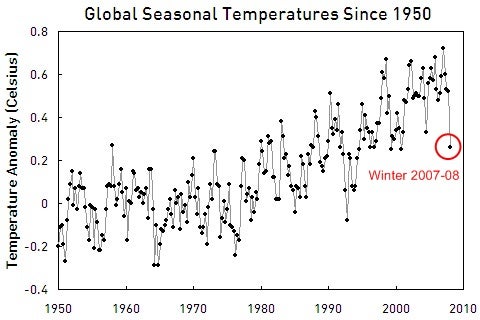
According to NOAA’s National Climatic Data Center, this past winter was the coolest since 2001. A single season can’t determine a long-term trend any more than a single month can (see my previous post, "Did Global Warming Stop in January?"). But the recent cooler temperatures do offer an opportunity to talk about La Niña – a climate pattern that causes short-term cooling.

This winter’s La Niña is the strongest (coldest) since 1989, so we’d expect the weather to be cooler than usual. But even so, the cooling didn’t come close to offsetting the warming of the past 50-100 years. As you can see in the graph below, the cooling barely takes us back to 2001.

Global Seasonal Temperatures, 1950-2008

Data source: NASA. Each dot is a three-month period (season).

Read More »

Posted in News / Read 19 Responses