(This post was co-written by EDF’s Martha Roberts and Ilissa Ocko)
As federal courts consider the legal merits of the U.S. Environmental Protection Agency’s (EPA) Clean Power Plan — America’s first-ever national limits on carbon pollution from power plants – we find ourselves in a situation that might have felt familiar to Galileo, who was hauled before authorities for having the temerity to make conclusions based on science.
Three hundred seventy-four years after Galileo, flat-earth Clean Power Plan opponents are using the court’s time to challenge EPA’s rock solid conclusions about the scientific realities of climate change. They’re using misinformation and misrepresentation in an attempt to block EPA’s flexible and efficient approach to reducing the carbon pollution that is causing so much costly damage to our society.
Yes, they’re still doing that in 2016.
The Usual Suspects
The latest assault takes the form of an amicus, or “friend of the court,” brief that was submitted last week to the U.S. Court of Appeals for the D.C. Circuit. It deploys selective reasoning and misleading arguments in an attempt to discredit evidence of climate change.
It’s numbingly familiar, but not surprising, to see Fred Singer’s name on the brief. A former tobacco industry mouthpiece, he’s been a mainstay for years in what’s been called the “parallel universe” of climate denial conferences.
It’s also no surprise that Peabody Energy — the world’s largest privately owned coal company — contested EPA’s rock solid climate science in an earlier submission to the court, given the company’s history of obfuscating the impacts of climate change in order to protect its profits.
The Real Motivation
This effort isn’t about debating science. It’s about using misinformation to obstruct climate progress. This attack is part of a longstanding effort to undermine EPA’s common sense solutions to limit harmful greenhouse gas pollution at all – despite that fact that the Supreme Court has repeatedly ruled that the Clean Air Act requires EPA to address climate pollution. Coal companies and their hired allies have relentlessly attacked EPA’s safeguards to protect human health and the environment from climate pollution.
Junk Science Amicus Brief
This junk science submission, authored by Singer and others, claims to be based on “real world empirical temperature data” (amicus brief, page 15) – but in truth it’s deceptively unscientific, cherry-picking dates and locations in an effort to rebut overwhelming evidence of rising surface temperatures.
Two obvious flaws demonstrate the problematic reasoning employed by the brief.
First, the authors contend that globally averaged surface temperature has not increased because:
The decade of the 1930s still has the most currently held high-temperature records for States within the United States. (amicus brief, page 31)
This point suffers from cherry picking data that seems to support their phony argument. Drawing a comparison between a long term globally averaged temperature trend (i.e., as related to anthropogenic climate change) and summertime regional temperature spikes in a select portion of the U.S. is inherently misleading (see Figure 1 below). The U.S. covers only two percent of the global surface area, and the Great Plains far less. Arguing that a small regional temperature anomaly undermines for the global temperature trend is scientifically untenable.
Figure 1: How Cherry-Picked Data Misrepresents the Larger Picture
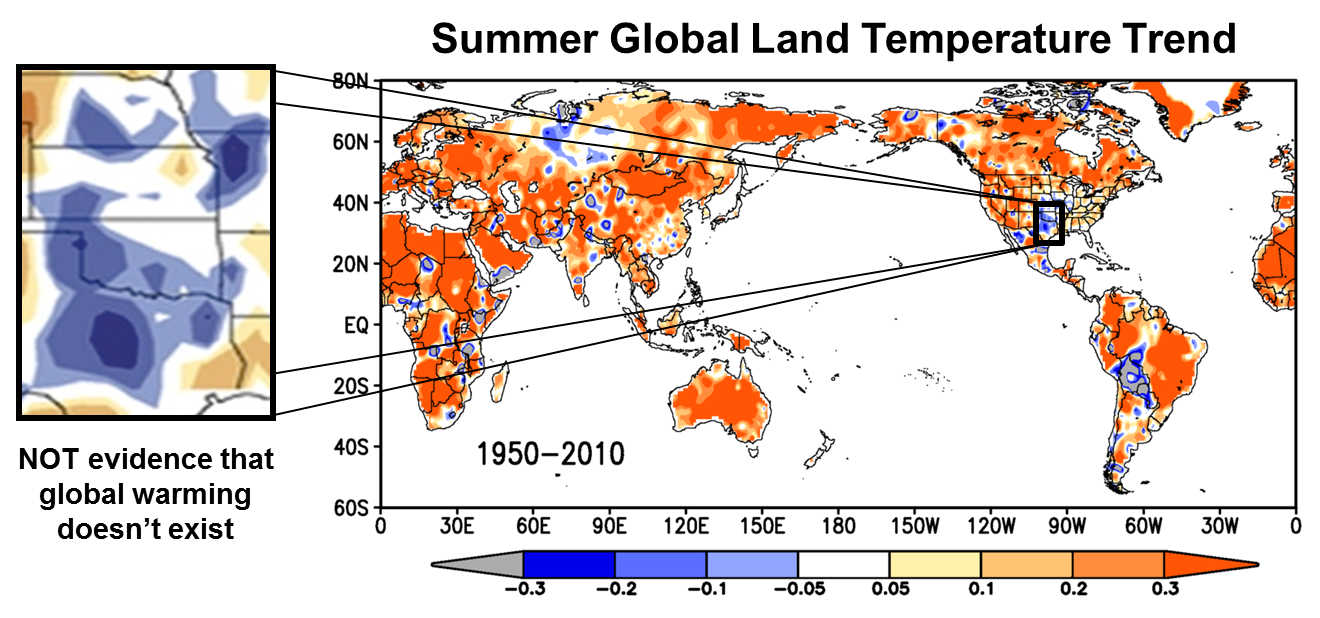
Source: The U.S. Global Historical Climatology Network Dataset
The second flaw is an egregious error with respect to defining a linear trend. The authors break the temperature time series in half and display two distinct trend lines separated by a large step increase, as opposed to the scientifically appropriate approach of employing the entire time series to define a trend.
Figure 2. The Amicus Brief’s Broken Time Trend 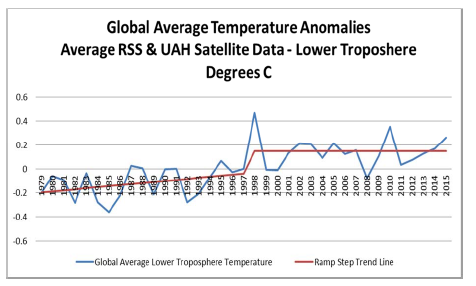
(amicus brief, page 7)
They do this to hide the trend. It’s a classic strategy used by the climate denial community to deny trends, known as the “escalator” (see Figure 3 below).
The authors argue that the absence of a trend in the latter portion of the record indicates a lack of evidence for an anthropogenic climate change signal during this time. However, their starting point for the latter half is during the 1997-1998 El Nino, one of the strongest such events on record. Given that El Nino has a significant warming influence on a given year’s global temperature, starting at this point in the record introduces a strong temperature bias — i.e. the authors purposely choose a starting point with an extremely high temperature in order to create the appearance of a plateau in the years that follow.
It’s a bit like beginning a chart of Barry Bonds’ home runs per season in 2001, when he hit 73. The authors fail to disclose that the globally averaged temperature exceeded the 1990’s average in every year of the first decade of the 21st century and that both 2014 and 2015 broke records as the hottest years ever recorded — further confirming their selection bias.
Figure 3: The Escalator — An Example of How One Can Manipulate a Trendline to Pretend That There Is No Trend
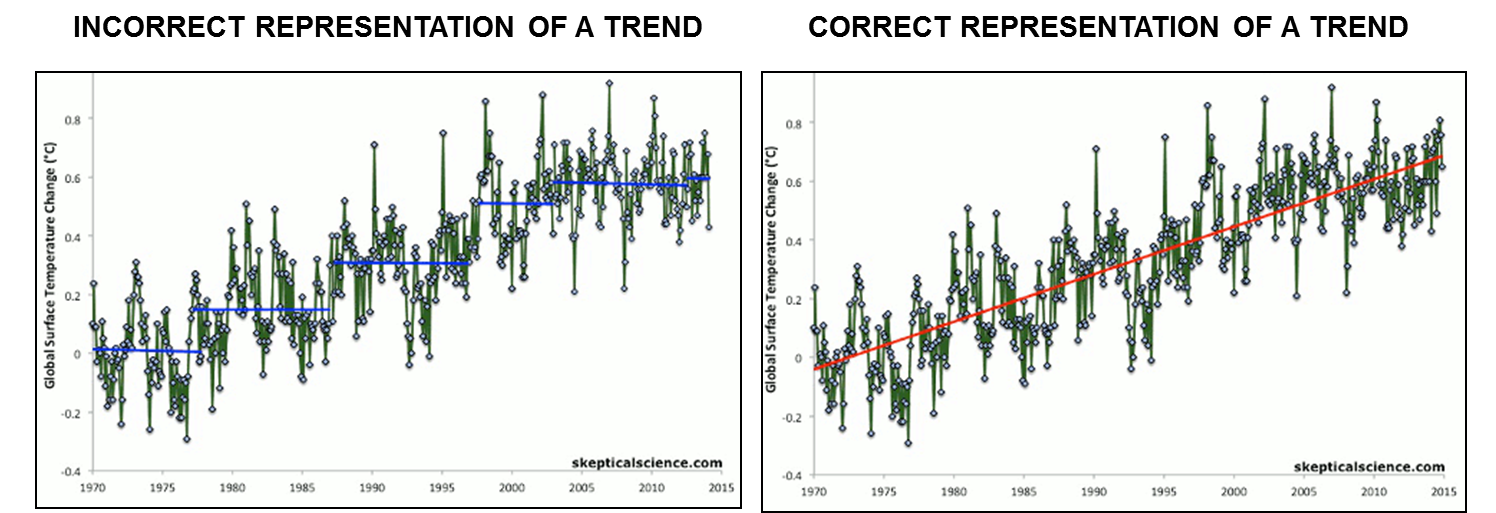
Source: skepticalscience.com
The brief also attempts to reject EPA’s conclusion that the atmosphere in the tropics warms faster than the surface as a response to rising carbon dioxide levels.
The brief presents data from only a single location in an attempt to rebut this conclusion — the tropical central and eastern Pacific Ocean, an area home to the El Nino Southern Oscillation (ENSO), the largest mode of natural interannual climate variability on the planet.
Using only one region (and in this case a single idiosyncratic point) to represent the entire global tropics is highly misleading and scientifically inappropriate. The data manifestly suffer from selection bias and are not representative of the full population of tropical climate data.
Indeed, the temperature time series shown in their analysis correlate extremely well with recently observed El Nino and La Nina events — suggesting that their index is simply a proxy for the El Nino/La Nina signal. Extracting a trend from an area with extremely large natural variability is inherently tenuous, because the large background variability swamps our ability to observe any other data trends.
Unfortunately, this is not the first time opponents have inaccurately distorted climate data in this case.
Earlier in this same crucial case, Peabody represented to the court that EPA’s claims of climate harms “substantially outrun the available evidence.” (brief, page 7 footnotes)
Peabody’s efforts to justify these misleading allegations misrepresent scientific understanding of climate science in several major respects. Two core inconsistencies, among several, include:
- Peabody’s biased assertion of hiatus in warming since 1998 — as mentioned earlier, beginning a trendline in 1998, an exceptionally warm year due to an unusually strong El Nino, is nonsensical and irrelevant to the long-term trend. Further, surface air temperatures are certainly still increasing. The 2000s were warmer than the 1990s, 2015 smashed all previous surface air temperature records, and heat uptake in the ocean has doubled over the last 20 years.
- Flawed reasoning that increasing Antarctic sea ice disproves climate change — Antarctic sea ice is influenced by differences in fresh water supply and circulation in the Southern Ocean. Land ice that has taken thousands of years to accumulate in Antarctica is melting at a rapid rate due to warmer temperatures, changing the chemistry of the water and likely preventing the buildup of sea ice. Peabody’s submission ignored and omitted this crucial context.
Sadly, it’s not really news that Peabody is presenting misleading climate information. Peabody, the largest private-sector coal company in the world, was cited last fall by the New York Attorney General for violating investor protection laws by misrepresenting climate risk in its corporate filings. The Attorney General noted that Peabody “repeatedly denied in public financial filings to the Securities and Exchange Commission that it had the ability to predict the impact that potential regulation of climate change pollution would have on its business, even though Peabody and its consultants actually made projections that such regulation would have severe impacts on the company.”


 A 1,000-year flood is supposed to be extremely rare. Its chance of occurring in a given year: 0.1 percent.

