Market Forces

Study: Renewables played crucial role in U.S. CO2 reductions

This blog was co-authored with Jonathan Camuzeaux, Adrian Muller, Marius Schneider and Gernot Wagner.

After a nearly 20-year upward trend, U.S. CO2 emissions from energy took a sharp and unexpected turn downwards in 2007. By 2013, the country’s annual CO2 emissions had decreased by 11% – a decline not witnessed since the 1979 oil crisis.

Experts have generally attributed this decrease to the economic recession, and to a huge surge in cheap natural gas displacing coal in the U.S. energy mix. But those same experts mostly overlooked another key factor: the parallel rise in renewable energy production from sources like wind and solar, which expanded substantially over the same 2007-2013 timeframe.

Between 2007 and 2013, wind generated electricity grew almost five-fold to 168 TWh and utility-scale solar from 0.6 TWh to 8.7 TWh. During the same period, bioenergy production grew 39 percent to 4,800 trillion BTUs.

Given these increases, how much did renewables contribute to the emissions reductions in the United States? In a paper published this month in the journal Energy Policy, we use a method called decomposition analysis to answer just that.

Unpacking the Factors

Decomposition analysis is an established method which enables us to separate different factors of influence on total CO2-emissions and identify the contribution of each to the observed decrease. The factors considered here are total energy demand, the share of gas in the fossil fuel mix (capturing the switch from coal and petroleum to gas), and the share of renewables and nuclear energy in total energy production.

Introducing a new approach for separately quantifying the contributions from renewables, we find that renewables played a crucial role in driving U.S. energy CO­2 emissions down between 2007 and 2013 – something which has previously largely gone unrecognized.

According to our index decomposition analysis, of the total 640 million metric ton (Mt) decrease (11%) during that period two-thirds resulted from changes in the composition of the U.S. energy mix (with the remaining third due to a reduction in primary energy demand). Of that, renewables contributed roughly 200 Mt reductions, about a third of the total drop in energy CO2 emissions. That’s about the same as the contribution of the coal and petroleum-to-gas switch (215 Mt). Conversely, increases in nuclear generation contributed a relatively minor 35 Mt.

While the significant role of renewables in reducing CO2 emissions does not diminish the contribution of the switch to natural gas, it is important to note that the climate benefits of switching from coal and petroleum to gas are undermined by the presence of methane leakage along the natural gas supply chain, the extent of which is likely underestimated in national greenhouse gas (GHG) emissions inventories.

Methane, of course, is a powerful greenhouse gas. Methane leakage from increased natural gas use could have wiped out up to 30% of the short-term GHG benefit (on a CO2-equivalent basis) calculated in this paper of switching from coal and petroleum to natural gas. For the natural gas industry to truly sustain the claim that it has made a positive contribution to reducing the country’s carbon footprint, the methane emissions associated with natural gas must be substantially reduced.

These results show that past incentives to support the expansion of renewable energy have been successful in reducing the country’s emissions, and that decreasing costs for renewable energy offers some hope for continued progress even despite the current administration’s refusal to address climate change.

Such progress, however, will never be sufficient without ambitious climate and clean energy policies- whether at the federal or at the state level – that can drive further emission reductions.

Posted in emissions, Energy efficiency / Comments are closed

California Bucks Global Trend with another Year of GHG Reductions

This post was co-authored by Maureen Lackner and originally appeared on the EDF Talks Global Climate blog.

The California Air Resources Board’s November 6 release of 2016 greenhouse gas (GHG) emissions data from the state’s largest electricity generators and importers, fuel suppliers, and industrial facilities shows that emissions have decreased even more than anticipated. California’s emissions trends are showing what is possible with strong climate policies in place and provide hope even as new analysis projects that global emissions will increase by 2% in 2017 after a three-year plateau.

California’s emissions kept falling in 2016

The 2016 emissions report, an annual requirement under California’s regulation for the Mandatory Reporting of Greenhouse Gas Emissions (MRR), shows that emissions covered by the state’s cap-and-trade program are shrinking, and doing so at a faster pace than in prior years. Covered emissions have dropped each year that cap and trade has been in place, amounting to 31 million metric tons of carbon dioxide-equivalent (MMt CO2e) over the whole period, or 8.8% reduction relative to 2012. The drop between 2015 and 2016 accounts for over half of these cumulative reductions (16 MMt CO2e; 4.8% reduction relative to 2015). The electricity sector is responsible for the bulk of this drop: electricity importers reduced emissions about 10 MMt CO2e while in-state electricity generation facilities reduced emissions by about 7 MMt CO2e.

Some sectors’ emissions grew in 2016. Just as with global transportation emissions, California’s transportation emissions have steadily crept up in recent years, and the MRR report suggests this trend is continuing. Transportation fuel suppliers, which account for the largest share of total emissions, reported a 1.8 MMt CO2e increase in emissions covered by cap and trade since 2015. Cement plants and hydrogen plants also experienced small increases in covered emissions. One of the benefits of cap and trade, however, is that if the clean transition is occurring more slowly in one sector, other sectors will be required to reduce further to keep emissions below the cap while the whole economy catches up.

Emissions that are not covered by the cap-and-trade program dropped, from 92 MMt CO2e in 2015 to 87 MMt CO2e in 2016. While small, this represents the largest reduction in non-covered emissions since 2012 and is mostly driven by suppliers of natural gas/NGL/LPG and electricity importers. Net non-covered and covered emissions reductions resulted in a 20.5 MMt CO2e drop in total emissions from these sectors.

These results are a welcome reminder that the cap-and-trade program is working in concert with other policies to accomplish the primary objective of reducing emissions.

The California climate policies are accomplishing their emissions reductions goals

The 2016 MRR data indicate impactful reductions in GHG emissions and progress toward reaching the state’s target emissions reductions by 2020. The 2016 emissions drop is a consequence of several factors: a CARB analysis of the year’s electricity generation points to increased renewable capacity, decreased imports of electricity from coal-fired power plants, and increased in-state hydroelectric power production. To put it in perspective, the 20.5 MMt CO2e emissions reductions is equivalent to offsetting the energy use of about 2.2 million homes, or 16% of California’s households.

Emissions below the cap are a climate win, not a concern

Total covered emissions in 2016 were about 324 MMt CO2e, well below California’s 2016 cap of roughly 382 MMt. Some observers of the cap-and-trade program worry that an “oversupply” of credits will result in reduced revenue for the state and lesser profits for traders on the secondary market. This concern was especially pronounced when secondary market prices dipped below the price floor in 2016 and 2017.

Importantly, oversupply of allowances is not a bad thing for the climate. As Frank Wolak, an energy economist at Stanford, points out, oversupply may be a sign of an innovative economy in which pollution reductions are easier to achieve than anticipated. Furthermore, having emissions below the cap represents earlier than anticipated reductions which is a win for the atmosphere. Warming is caused by the cumulative emissions that are present in the atmosphere so earlier reductions mean gases are not present in the atmosphere for at least the period over which emissions are delayed.

While market stability is a valid concern, the design of the program has built-in features to prevent market disruptions. Furthermore, the California legislature’s recent two-thirds majority vote to extend the cap-and-trade program through 2030 provides long-term regulatory certainty. Both the May and August auctions were completely sold out suggesting that the extension has succeeded in stabilizing demand.

These results are a welcome reminder that the cap-and-trade program is working in concert with other policies to accomplish the primary objective of reducing emissions, and that we’re doing it cheaply is an added bonus. Early reductions at a low cost can lead to sustained or even improved ambition as California implements its world-leading climate targets.

As California closes its fifth year of cap and trade, it should be with a sense of accomplishment and optimism for the future of the state’s emissions.

Posted in California, Cap and Trade, Cap and Trade Watch, Economics / Comments are closed

How and why farmers in the Catskills protect New York City’s drinking water

At a recent EDF board meeting, Geoffrey Heal talked about the economic values that ecosystem services provide for our economic well-being. His presentation included a number of case studies, including the New York City Department of Environmental Protection’s financial support for farmers in the Catskills to farm in ways that protect the city’s water quality. The key to the business model: farmers benefit by getting financial support from the City of New York, and the city avoids having to go through a costly filtration system to physically remove impurities or contaminants in a series of filters. The city water supply does undergo UV decontamination.

Last week, the staff of EDF’s Office of the Chief Economist decided to see for ourselves how this works in practice. We visited with Gibson Durnford, the East of the Hudson Agricultural Coordinator of the Watershed Agricultural Council, based in Yorktown Heights, New York. A non-profit organization led by local farmers, it started in 1993 to lead and administer the program.

Incentives for farmers and the City are aligned

Gibson explained that customers in New York City consume 1 billion gallons of water a day, which is supplied from the West and East Hudson systems. There is one and a half years of water in storage (550 billion gallons).

If farmers did not protect the Delaware and Catskill water sheds, the City would have to make a an estimated capital investment of $8-10 billion in water filtration plants and spend an additional $100 million annually to operate them. Phosphate is a particular problem, and the city would also have to deal with sediment running off the farms into the water supply system.

For farmers, payments for eco-services compensate and empower private landowners to be surface-water stewards of New York City’s drinking water. Whole farm management plans are agreed with farmers, incorporating best management practices that both support sustainable farming and protect water quality; concentrated manure sources like slurry pits or storage piles are a greater concern than waste in the fields. If fields are well-vegetated with grass, the plants will take up nutrients; the vegetation slows water flow and also makes the soil more porous and increases absorption.

Farmers are provided with investment funds for purposes which include drainage, roading, manure pads, and sward management; conservation easements are purchased (a percentage of market value) which simultaneously lets the farmer retain ownership of the land, releases capital for the owner while ensuring that the land remains available for farming and forestry; the forest program helps farmers with erosion control, sustainable harvesting, and planting on the banks of tributaries.

Conservation in action at an Alpaca farm
We visited Leda Bloomberg and Steve Cole’s Faraway Farm, where they raise Alpaca sheep for their wool. The Watershed Agricultural Council supported the installation of a manure pad, and of a rocky channel along the roadway had drains it to collect the water running off the field and divert it away for infiltration into the soil. Leda and Steve indicated that they had benefited greatly from the advice and support of the Watershed Council. The council is “on the side of the farmers” and is proactive in finding new and better ways to conserve and better their well-being.

The economist Ronald Coase won the Nobel Prize, in part for theorizing (without evidence) that those who pollute could negotiate a solution with those who would benefit from pollution reduction. We were honored and delighted to see his theory being acted upon to such great positive effect for both farmers upstate and the water consumers in New York City. As we left, we had only one question: Doesn’t such a great idea deserve to be replicated?

Posted in Economics / Comments are closed

Trump Administration misleads Americans about the cost of climate pollution

This blog post originally appeared on Climate 411.

The Trump Administration is attempting to justify the rollback of crucial environmental and health protections by vastly undervaluing the costs of climate change.

The latest safeguards under attack are the Clean Power Plan, the nation’s first-ever limits on carbon pollution from existing power plants, and the Bureau of Land Management’s vital standards to reduce wasted natural gas from oil and gas facilities on public and tribal lands. They would have health, environmental, and economic benefits worth an estimated billions of dollars annually. But you wouldn’t know it from reading the Administration’s recently revised documents – because of a series of deceptive accounting tricks, including efforts aimed at obscuring the benefits of reducing carbon pollution.

The Trump Administration has used discredited methods to eviscerate the social cost of carbon — an estimate of the costs that carbon pollution inflicts on the public, represented as the dollar value of the total damages from emitting one ton of carbon dioxide into the earth’s atmosphere.

The social cost of carbon is a tool that helps ensure that policymakers consider the health, environmental and economic benefits of avoiding extreme weather, rising temperatures and intensifying smog when they make decisions that affect climate pollution.

Climate change harms businesses, families, governments and taxpayers through rising health care costs, destruction of property, increased food prices and more — so it’s common sense that we should properly account for the value of avoiding these harmful outcomes. But the Trump Administration has systematically undermined and attacked the well-established science of climate change – including the social cost of carbon, which has had a target on its back for a while now.

The most up-to-date estimates of the social costs of carbon were developed by an Interagency Working Group (IWG) of experts from a dozen federal agencies. They were developed through a transparent and rigorous process based on the latest peer-reviewed science and economics, and with input from the public and the National Academy of Sciences.

But in March, President Trump cast aside the results of this thorough and consultative process. He issued an executive order aimed at discrediting the IWG estimates, withdrawing them as government policy, and directing federal agencies to pick their own metric.

The executive order leaves federal agencies to fend for themselves without specific guidance, opens the door to extensive legal challenges, and effectively sets up agencies to cook the books to serve the Administration’s goals.

That’s exactly what EPA Administrator Scott Pruitt and Department of the Interior Secretary Ryan Zinke just did – releasing benefit-cost analyses that massively undervalue the costs of carbon pollution, radically reducing the estimates by up to 97 percent.

The Trump Administration would have us believe that the costs of carbon pollution are near zero. The Administration’s new estimates are only a couple dollars per ton of carbon dioxide – about as much as a cup of coffee or a bus ticket.

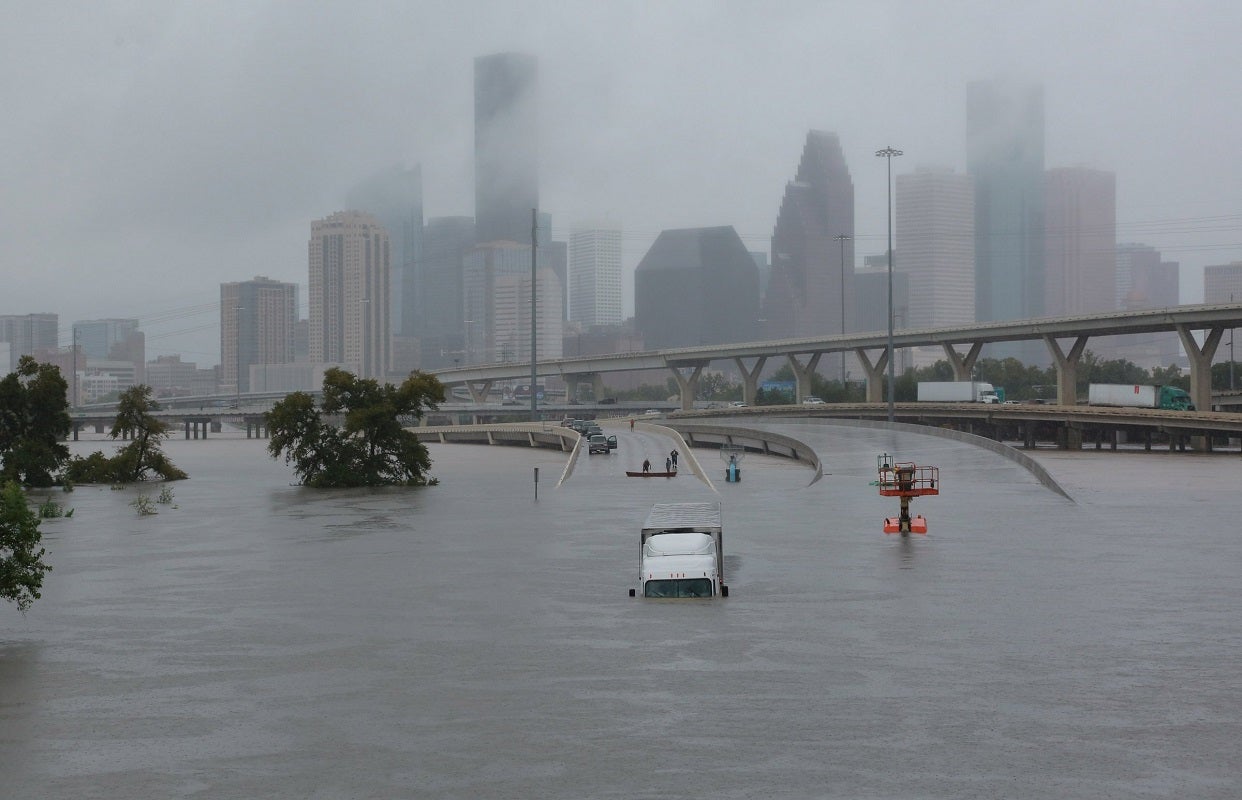
Sadly, communities around the country are already seeing just how wrong that is. From longer wildfire seasons to more intense hurricanes, the American public is already bearing the enormous costs of climate change.

Even the IWG estimates – roughly $50 per ton of carbon dioxide based on year 2020 emissions – are almost certainly a conservative lower bound since they do not yet reflect many different types of climate impacts.

A closer look at the Administration’s deceptive math 

There are two major flaws in the Administration’s drastically reduced estimates, both of which fly in the face of established science and economic principles in service of obscuring the very real benefits of climate action.

First, the reduced estimates ignore that carbon emissions are a global pollutant, so they omit important categories of climate change impacts on the United States.

Second, they shortchange the harm to our children and future generations from climate change.

The so-called “domestic-only” estimate

Since the impacts of carbon pollution are felt globally regardless of where the emissions come from, leading researchers and the IWG have appropriately focused on accounting for that full global impact.

In contrast, the Administration’s revised estimates claim to consider “domestic-only” impacts to the United States. But that title is a misnomer – the Administration’s flawed approach ignores important categories of impacts that affect the American public. Climate impacts beyond our borders have costly repercussions for U.S. citizens in the form of changing global migration patterns, economic and political destabilization, and other “spillover” effects.

The National Academy of Sciences specifically rejected the approach the Administration is taking in a report released earlier this year, concluding that:

[C]limate damages to the United States cannot be accurately characterized without accounting for consequences outside U.S. borders.

Economist Richard Newell – president of the think tank Resources for the Future, which is leading an effort to implement the Nation Academy of Sciences’ recommendations to update the social cost of carbon estimates – has criticized the Administration’s approach, saying that considering only direct domestic impacts is:

[U]nnecessarily constrained and unwise for addressing inherently global pollutants like greenhouse gases.

The use of a “domestic-only” number also harms Americans because it undervalues the cost of climate pollution and encourages other countries to similarly undervalue – and over-emit – this pollution.

More than half a dozen leading experts argue:

[The] United States benefits tremendously if other countries set policy based on global rather than local effects.

They also point out that the use of a global estimate can encourage reciprocal climate action elsewhere. For instance, the Canadian government incorporated the U.S. IWG value in its own policy analysis.

Undervaluing the impacts on children and future generations

The Administration’s estimates also use a sharply lower value for the benefits that today’s carbon reductions provide to children and future generations. Again, this is in direct conflict with the weight of expert opinion that supports valuing these impacts even more than we did before the Trump Administration.

The Administration’s estimates “discount” future impacts at 7 percent – a rate significantly higher than the 3 percent central rate of the IWG, and one that is wholly unsupported by the economics literature when it comes to the long-lived intergenerational effects of carbon pollution.

A growing consensus among leading economists supports lower or declining discount rates, as does the Council of Economic Advisors.

As Richard Newell of Resources for the Future points out:

Practically speaking, the use of such a high discount rate means that the effects of our actions on future generations are largely unaccounted for in the new analysis.

In other words, the Administration’s estimates reveal just how little they value protecting American children and generations to come.

The social cost of carbon has profound influence on our policy process and embodies the very real costs of climate change that communities around the country are already feeling.

The Administration’s distortion of these values is illustrative of a frequent strategy of theirs – twisting the facts to validate their desired outcome, and in the process sowing doubt around the overwhelming scientific consensus on climate change.

Unfortunately, while the math the Administration is using is warped, the costs of climate change are still very real – and the American public is footing the bill.

Posted in Clean Power Plan, Economics, Social Cost of Carbon / Comments are closed

How climate policy can mitigate extreme weather’s economic toll


This post was co-authored with Maureen Lackner

In the wake of hurricanes Harvey and Irma, Americans are coming together to support communities as they recover from the physical, emotional and economic toll after lives, possessions and livelihoods were washed away. Reestablishing daily routines, including work, school and regular commerce will take time, and for many, life may not return to what was once considered normal. But as we begin rebuilding what can be replaced, it is necessary to first gauge the scale and cost of the damage. It is also time to face the possibility that devastating weather events like Harvey and Irma may become the new normal

Harvey and Irma are among the most expensive hurricanes in U.S. history

Harvey and Irma have brought front and center the high costs of extreme weather-related disasters. While the damage is still being assessed, Harvey’s could cost as much as $200 billion, making it the most expensive natural disaster in U.S. history, surpassing Hurricane Katrina ($194 billion in 2017 USD). Estimates of Hurricane Irma’s economic damage are less certain, but the storm will likely also be among the most expensive weather-related disasters in the United States. (And we can’t forget that before reaching Florida, Irma caused damage to many Caribbean islands, which in some cases exceeded their GDP.)

While hurricanes tend to be the most dramatic, other types of severe weather also cause billions of dollars in economic damages. During the first half of 2017 alone, nine weather events including hailstorms, flooding, and tornados racked up $16 billion in damages across several states.

Climate change elevates the risk of severe weather events, and that comes at a cost

Climate change doesn’t cause hurricanes, but sea level rise and warmer temperatures make storms more destructive. Storm surges along the Texas coast where Hurricane Harvey hit are now about 7 inches higher than storm surges a few decades ago as a result of sea level rise, which can make a big difference in flooding. In addition, evaporation intensifies with warmer temperatures, which results in more moisture in the atmosphere and therefore higher rainfall amounts and flooding when storms make landfall. Warmer ocean temperatures also fuel hurricanes, making them more powerful. Hurricane Irma was a classic example of just how powerful a storm can get from increased ocean temperatures.

It is also possible that severe weather-related events overall are becoming more frequent. One recent EDF analysis shows that U.S. counties experienced, on average, a fourfold increase in the frequency of disaster level hurricanes, storms, and floods between 1997 and 2016 than in the 20 years prior. In the Southeast, this increase is even more pronounced; on average, its states experienced close to four-and-a-half times more disaster declarations over the same time period.

In the coming decades, risk of climate change-influenced severe weather will differ from region to region, but one thing is clear: if left unmitigated, the effects of climate change could come at serious economic costs, not just to those who lose homes and livelihoods, but to their insurance companies or to taxpayers. Other aspects of the economy could experience significant pain as well.

In the Southeast alone, higher sea levels resulting in higher storm surges could increase the average annualized cost of storms along the Eastern seaboard and Gulf Coast by $2-3.5 billion by 2030. In some areas, like Texas, where sea levels are rising faster than the global average, these increases even higher. Research published in Science suggests that even if storms themselves do not become more severe, direct annual economic damage could rise by 0.6 to 1.3% of state gross domestic product (GDP) for South Carolina, Louisiana, and Florida under median estimates of mean sea level rise. This translates into billions of dollars in additional economic damage every year for each of these states.

Hurricanes and severe storms pose serious risks to U.S. energy infrastructure

During Hurricane Katrina, the extent of the damages suffered by Entergy New Orleans forced the utility into bankruptcy. Hurricane Irma caused power outages in Florida that left over six million people without power.

Beyond these local impacts, these events can cause damage nationwide. Texas is home to about 30% of domestic oil and gas refining capacity, half of which was disrupted by Hurricane Harvey. This shut down 16% of the nation’s total refining capacity, spiked the average national gasoline price approximately 37 cents per gallon, and forced crude exports to drop from 749,000 to 153,000 barrels per day in the week after Harvey. As of September 10, 2017, more than two weeks after Hurricane Harvey made landfall, five Gulf Coast refineries remained closed, representing 11% of total Gulf Coast refining capacity and 5.8% of U.S. refining capacity.

The Trump administration should focus on adaptation and mitigation

In the short term, the Trump administration should maintain existing programs designed to enhance U.S. energy security and disaster response. For starters, the administration should stop dismantling EPA programs expressly designed to help communities respond to damage from storms.

In the long term, we need to build climate resilient communities and infrastructure, through efforts like wetland restoration and smart development. President Trump would also do well to listen to Miami’s Republican Mayor Tomás Regalado, and rethink his approach to climate policy. Instead of rolling back smart policies and regulations, or simply ignoring the impacts of climate change, we need to stop compounding the problem and mitigate the effects of a warmer climate through policy that sets aggressive emissions reduction targets. Such strategies will do much more than just protect our economy’s bottom line—it will help ensure the safety, security, and well-being of millions of Americans.

Posted in Climate science, Politics / Comments are closed

Alternative Facts: 6 Ways President Trump’s Energy Plan Doesn’t Add Up

Photos by lovnpeace and KarinKarin

This blog was co-authored with Jonathan Camuzeaux and is the first in an occasional series on the economics of President Trump’s Energy Plan

Just 60 days into Trump’s presidency, his administration has wasted no time in pursuing efforts to lift oil and gas development restrictions and dismantle a range of environmental protections to push through his “America First Energy Plan.” An agenda that he claims will allow the country to, “take advantage of the estimated $50 trillion in untapped shale, oil, and natural gas reserves, especially those on federal lands that the American people own.”

Putting aside the convenient roundness of this number, the sheer size of it makes this policy sound appealing, but buyer beware. Behind the smoke and mirrors of this $50 trillion is a report commissioned by the industry-backed Institute for Energy Research (IER) that lacks serious economic rigor. The positive projections from lifting oil and gas restrictions come straight from the IER’s advocacy arm, the American Energy Alliance. Several economists reviewed the assessment and agreed: “this is not academic research and would never see the light of day in an academic journal.”

Here is why Trump’s plan promises a future it can’t deliver:

1. No analytical back up for almost $20 trillion of the $50 trillion.
Off the bat, it’s clear that President Trump’s Plan relies on flawed math. What’s actually estimated in the report is $31.7 trillion, not $50 trillion, based on increased revenue from oil, gas and coal production over 37 years (this total includes estimated increases in GDP, wages, and tax revenue). The other roughly half of this “$50 trillion” number appears to be conjured out of thin air.

2. Inflated fuel prices
An average oil price of $100 per barrel and of $5.64 per thousand cubic feet of natural gas (Henry Hub spot price) was used to calculate overall benefits. Oil prices are volatile: in the last five years, they reached a high of $111 per barrel and a low of $29 per barrel. They were below $50 a barrel a few days ago. A $5.64 gas price is not outrageous, but gas prices have mostly been below $5 for several years. By using inflated oil and gas prices and multiplying the benefits out over 37 years, the author dismisses any volatility or price impacts from changes in supply. There’s no denying oil and gas prices could go up in the future, but they could also go down, and the modeling in the IER report is inadequate at best when it comes to tackling this issue.

3. Technically vs. economically recoverable resources
The IER report is overly optimistic when it comes to the amount of oil and gas that can be viably produced on today’s restricted federal lands. Indeed, the report assumes that recoverable reserves can be exploited to the last drop over the 37-year period based on estimates from a Congressional Budget Office report. A deeper look reveals that these estimates are actually for “technically recoverable resources,” or the amount of oil and gas that can be produced using current technology, industry practice, and geologic knowledge. While these resources are deemed accessible from a technical standpoint, they cannot always be produced profitably. This is an important distinction as it is the aspect that differentiates technically recoverable from economically recoverable resources. The latter is always a smaller subset of what is technically extractable, as illustrated by this diagram from the Energy Information Administration. The IER report ignores basic industry knowledge to present a rosier picture.

4. Lack of discounting causes overestimations
When economists evaluate the economic benefits of a policy that has impacts well into the future, it is common practice to apply a discount rate to get a sense of their value to society in today’s terms. Discounting is important to account for the simple fact that we generally value present benefits more than future benefits. The IER analysis does not include any discounting and therefore overestimates the true dollar-benefits of lifting oil and gas restrictions. For example, applying a standard 5% discount rate to the $31.7 trillion benefits would reduce the amount to $12.2 trillion.

5. Calculated benefits are not additional to the status quo
The IER report suggests that the $31.7 trillion would be completely new and additional to the current status quo. This is false. One must compare these projections against a future scenario in which the restrictions are not lifted. Currently, the plan doesn’t examine a future in which these oil and gas restrictions remain and still produce large economic benefits, while protecting the environment.

6. No consideration of environmental costs
Another significant failure of IER’s report: even if GDP growth was properly estimated, it would not account for the environmental costs associated with this uptick in oil and gas development and use. This is not something that can be ignored, and any serious analysis would address it.

We know drilling activities can lead to disastrous outcomes that have real environmental and economic impacts. Oil spills like the Deepwater Horizon and Exxon Valdez have demonstrated that tragic events happen and come with a hefty social, environmental and hard dollar price tag. The same can be said for natural gas leaks, including a recent one in Aliso Canyon, California. And of course, there are significant, long-term environmental costs to increased emissions of greenhouse gases including more extreme weather, damages to human health and food scarcity to name a few.

The Bottom Line: The $50 Trillion is An Alternative Fact but the Safeguards America will Lose are Real
These factors fundamentally undercut President Trump’s promise that Americans will reap the benefits of a $50 trillion dollar future energy industry. Most importantly, the real issue is what is being sacrificed if we set down this path. That is, a clean energy future where our country can lead the way in innovation and green growth; creating new, long-term industries and high-paying jobs, without losing our bedrock environmental safeguards. If the administration plans to upend hard-fought restrictions that provide Americans with clean air and water, we expect them to provide a substantially more defensible analytical foundation.

Posted in Markets 101, Politics, Trump's energy plan / Comments are closed