EDF analysis: Lead service lines in Illinois communities
Written By

Share
Tom Neltner, J.D., Chemicals Policy Director
Building statewide, comprehensive inventories of lead service lines (LSLs) in community water systems (CWSs) is a critical part of any effort to eliminate lead pipes. With a solid inventory, states can conduct a credible needs assessment and engage the public in supporting community efforts to replace LSLs.
In January 2017, the Illinois legislature passed a law designed to reduce children’s exposure to lead in drinking water. It included a requirement that CWSs submit annual reports to Illinois Environmental Protection Agency (IEPA) regarding a “water distribution system material inventory” by April of each year. EDF sees Illinois’s approach to developing an inventory as a model to be considered by other states because it:
- Requires all CWS to report (unlike Indiana which had a well-designed one-time voluntary survey but only a 57% response);
- Covers the entire service line (unlike California which ignored the portion of the service line on private property); and
- Requires annual updates to track progress, especially in reducing the number of service lines with unknown materials (unlike Michigan which requires updates only every five-years).
In August 2018, IEPA released a summary of the first year submissions and has updated it several times. IEPA indicated that 95% of CWSs submitted reports and provided totals of each type of piping material reported with 414,895 LSLs and 1,504,748 of unknown material. At the time, the agency did not provide information on what each CWS reported.
Making totals public is important but does little to engage the public in understanding what the information means for their community. But earlier this week, IEPA published an online tool, which allows residents to search for their water system and download the data for individual reports of the types of materials currently reported by their water system. EDF also received the information pursuant to a Freedom of Information request. Click here to see the data for all the CWSs in a spreadsheet. We also used an EPA database to identify the 84 CWSs that did not comply with the law.
Table 1 below provides the results for the ten CWSs in Illinois serving more than 100,000 people. Collectively, these ten CWSs have about a quarter of the state’s service lines, but have almost half of all known LSLs and 39% of the service lines where the materials are unknown – and, therefore, may be lead. Chicago tops the list with almost half a million service lines, of which 120,010 are lead (24%) and almost all of remaining are of unknown material.
Table 1: Service line materials reported in 2018 by Illinois community water systems (CWSs) serving more than 100,000 people
| CWS Name (PWS ID) | Lead: Reported Service Lines | Galvanized: Reported Service Lines | Unknown: Reported Service Lines | Copper/ Plastic: Reported Service Lines | Total Reported Service Lines |
|---|---|---|---|---|---|
| CHICAGO (IL0316000) | 120,010 | 11,298 | 362,843 | 4 | 494,155 |
| IL AMERICAN-PEORIA (IL1435030) | 11,687 | 58 | 28,718 | 22,557 | 63,020 |
| IL AMERICAN-CHAMPAIGN (IL0195300) | 0 | 0 | 60,360 | 0 | 60,360 |
| ROCKFORD (IL2010300) | 14,026 | 97 | 24,814 | 20,849 | 59,786 |
| SPRINGFIELD (IL1671200) | 32 | 81 | 54,635 | 155 | 54,903 |
| IL AMERICAN-EAST ST LOUIS (IL1635040) | 513 | 0 | 50,851 | 0 | 51,364 |
| JOLIET (IL1970450) | 17,000 | 1 | 0 | 32,725 | 49,726 |
| AURORA (IL0894070) | 22,403 | 114 | 138 | 26,317 | 48,972 |
| NAPERVILLE (IL0434670) | 334 | 8 | 501 | 42,103 | 42,946 |
| ELGIN (IL0894380) | 11,055 | 3 | 7,668 | 14,282 | 33,008 |
| Totals for CWSs serving more than 100,000 people | 197,060 | 11,660 | 590,528 | 158,962 | 958,240 |
| Percentage of lines reported by CWSs serving more than 100,000 people compared to total for Illinois | 47% | 17% | 39% | 9% | 26% |
Among CWSs serving between 50,000 and 100,000 people, three – Cicero, Berwyn, and Evanston – reporting having more than half of their service lines made of lead with Cicero topping the list with 98%. IEPA officials are working with the U.S. EPA and officials from Cicero and Berwyn regarding concerns of lead in the drinking water in those communities.
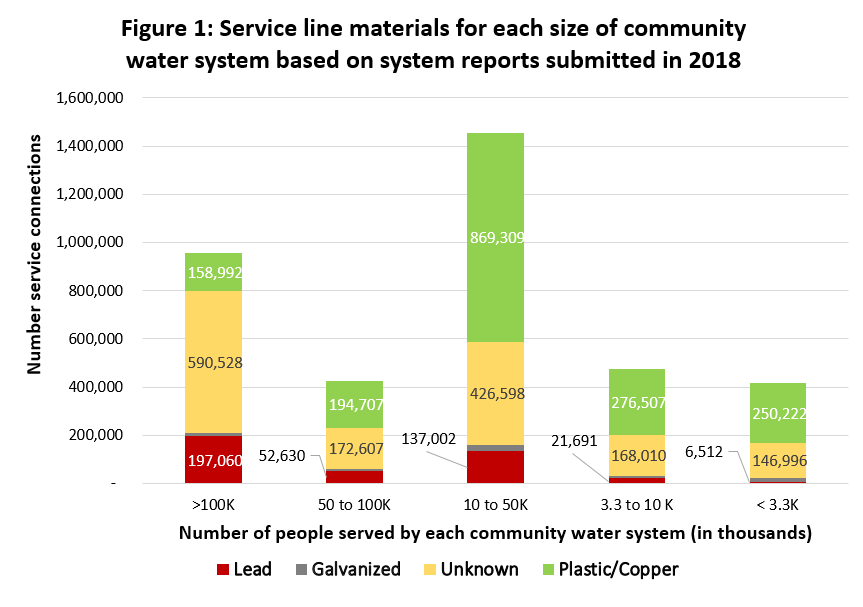
In Figure 1, we organized the CWSs into five categories based on the population served and reported the number of each type of service line material. The most striking feature is that for all but the largest CWSs, between 40% and 54% of the service lines are either lead, galvanized[1], or unknown material – much fewer than the 83% for the largest CWSs. Note IEPA required three types of service lines – plastic, copper with lead solder, and copper without lead solder – to be reported separately but we grouped them together. For future years, IEPA will expand reporting options to include ductile/cast iron and transite. These two types of materials, used primarily for larger diameter lines, were included in unknowns in the first round of reporting. IEPA will also allow CWSs to report separately unknowns that they are confident are not lead.
We encourage IEPA to allow comparisons across years so people can track progress identifying unknowns and replacing LSLs. Further, in addition to the table, making it available in a map format like we did in Indiana would benefit residents and policymakers of the state.
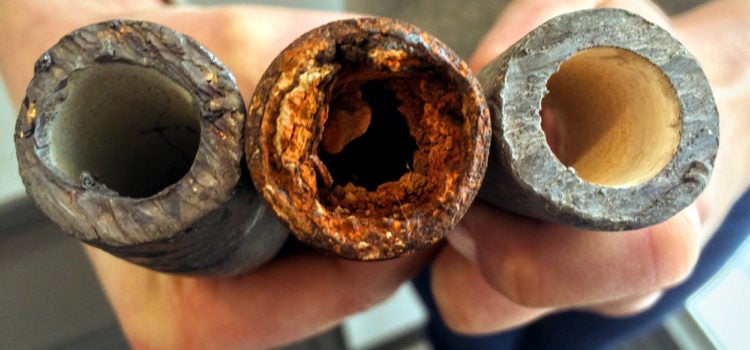
[1] Galvanized pipes are often connected to the main by a short lead pipe known as a gooseneck. Even if the lead pipe has been removed, the galvanized pipe may contain significant amounts of lead particulate on the inside.