Lead service line inventories – Indiana as a good model of a voluntary survey
Written By

Share
Tom Neltner, Lindsay McCormick, and Audrey McIntosh
This blog is part of a series focused on how states are handling the essential task of developing inventories of lead service lines (LSLs) and making them public. The first blog identified 14 states that were taking on the issue: 4 with mandatory programs and 10 with voluntary. The second blog described programs in four states that mandate an inventory. In this blog, we highlight Indiana’s 2016 voluntary survey of utilities operating community water systems (CWSs) as a model because it ask utilities to: 1) identify who owns the line and provide the legal basis for that claim; and 2) rate its confidence in its estimates on a 1 to 10 scale.
We found no other state survey asked about LSL ownership even though it is a central question in determining who is expected to pay for replacement. The Environmental Protection Agency’s (EPA) National Drinking Water Advisory Council (NDWAC) recommended[1] in 2015 that the agency require utilities to provide states this information as part of a revised Lead and Copper Rule (LCR). Unfortunately, 43% of the 781 CWS did not respond to Indiana’s survey, revealing a serious limitation of voluntary surveys.
In January 2016, a month before EPA encouraged states to develop an inventory of LSLs and make it available to the public, the Indiana Department of Environmental Management (IDEM) sent a two-page survey to utilities that operate CWSs in the state asking about drinking water service lines. The agency posted scanned PDF copies of the individual responses online but has not yet released a summary.[2]
While short, the survey requests detailed information – some of which we have not seen in other state surveys. The surveys asks for:
- Service line material: Estimated number of service lines in six categories:
- No lead pipe in any portion of the line
- Material is unknown
- Only lead pipe is gooseneck
- Entire line is lead pipe
- Lead pipe from main to external shut-off, curb, or property line (on public property)
- Lead pipe from external shut-off to home (on private property)
- Total LSL estimate: A tally of service lines with lead pipe anywhere between the main and interior plumbing, based on the above estimates.
- Information sources:
- Sources the utility checked for service line information and which of those contained details on service line materials;
- For each of the above six categories of service line materials:
- Whether numbers are estimated or from records; and
- Confidence in records or estimates on a 1 to 10 scale (10 being very confident).
- Ownership: Who owns the service line on public and on private property (from the four options below) between the main under the street and the interior plumbing as well as legal citation establishing such ownership:
- Municipality
- Public water system[3]
- Resident
- Unknown / Not sure
Ownership is an important issue because it is a factor in determining: 1) if the property owner is expected to pay for a portion of the replacement; 2) whether the utility can use rates paid by other customers to replace the LSL; and 3) the logistical challenges the utility may face if it seeks to replace the LSL. As noted above, NDWAC recommended that EPA revise its LCR to require utilities to provide the state with this type of information.
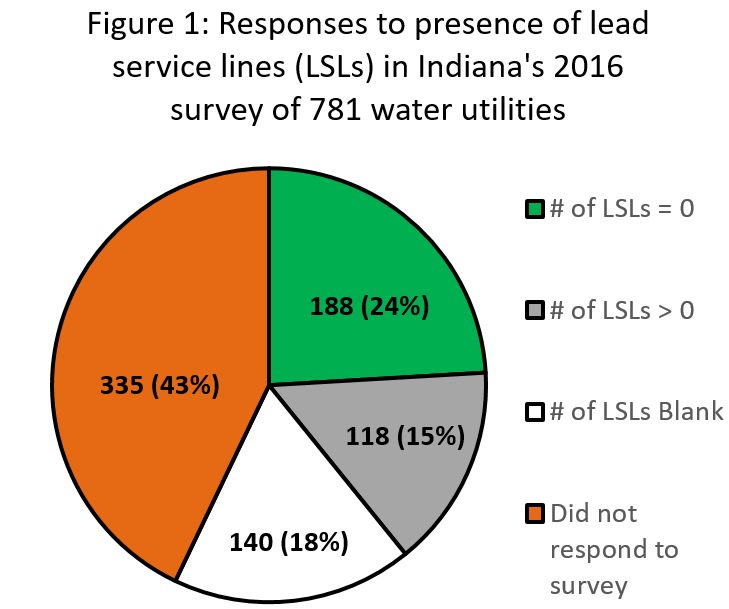 We obtained a spreadsheet of the responses from IDEM and matched it to the information about active CWSs in EPA’s Safe Drinking Water Information System (SDWIS). We found that 57% (446 of 781) of the active CWSs[4] responded. Almost 1/3 of those that responded (140 CWSs) did not provide any estimate of the number of service lines made of lead pipe – the field was simply left blank. See Figure 1.
One of the challenges with a voluntary survey is that utilities may not feel compelled to respond. While Indiana had a good response rate of 57% for a voluntary survey (but less than the 87% Illinois had with a mandatory survey),[5] it is not credible to base an estimate solely on responses; the impact of those who did not respond must be considered. Therefore, we used SDWIS information to determine that Indiana’s utilities have a total of 1.87 million service lines. The 446 utilities that responded covered 92% of these service lines (1.72 million). The largest utilities that did not respond were in Michigan City, Crown Point, and Marion City; the rest had less than 7,600 service lines in their system and the vast majority of these had less than 1,000 service lines.
Using the total service lines in the state as a denominator, we calculated that 68% of the state’s 1.87 million total service lines did not have lead pipe in any portion of the line. Of the remaining 32% (599,000 service lines[6]):
- 206,000 had lead pipe in a portion;
- 268,000 were unknown materials and, therefore, could be lead pipe in a portion; and
- 125,000 were unaccounted for in the responses or from utilities that did not respond.
We identified how many of the 446 active CWSs that responded to the survey said they owned the public side, the private side, or both sides of the line. See Table 1 below for a summary. If the service line is owned by the property owner, the utility often expects the property owner to pay for the replacement.
Table 1: Ownership of drinking water service lines on public and private property in Indiana
| Response to question | Ownership on public property | Ownership on private property |
|---|---|---|
| Did not respond to survey | 335 (43%) | 335 (43%) |
| Did not answer question | 24 (3.1%) | 23 (2.9%) |
| Municipal or System owned | 391 (50%) | 68 (8.7%) |
| Resident owned | 27 (3.5%) | 349 (45%) |
| Mixed or unknown | 4 (0.5%) | 6 (0.8%) |
Note that the largest water utility in the state, Citizens Water – Indianapolis with 325,000 service lines,[7] reported that the resident owns the entire service line. It based its report on the terms and conditions for rates as approved by the Indiana Utility Regulatory Commission (IURC). The utility reported having 23,482 service lines with lead pipe and 52,232 with unknown material.
Overall, the ownership questions on Indiana’s survey form are a model for other states and EPA in a national requirement. While the response rate of 57% was less than we’d expect to see with a mandatory survey, it provides sufficient information to scope out the issue because the respondents addressed 92% of all service lines. While the American Water Works Association Survey estimated that the state had 290,000 LSLs, based on Indiana’s survey, the state has between 206,000 and 599,000 LSLs. In a future blog, we will use Indiana’s survey responses to provide an example of how states could present utility inventories in an interactive map.
[1] In December 2015, NDWAC advised EPA that it unanimously agreed with the recommendations of NDWAC’s Lead and Copper Rule Working Group in its Report. Recommendation #5 in that report stated “The revised LCR should require PWSs [public water systems] to clearly state how the PWS defines ownership of LSLs, who has what financial responsibility for the replacement, what the legal basis is for that determination and any financial assistance programs that may be available.” See section 3.1.2 on page 17.
[2] Search https://vfc.idem.in.gov/DocumentSearch.aspx, and enter “DW Compliance” for program, “Compliance” for document type, and “service line information” for full text search.
[3] The survey did not explain the difference between municipal owned and public water system owned. We presume it might be different when the CWS is owned or operated by an investor-owned company or a quasi-government entity.
[4] Five non-CWSs and two inactive systems also responded to the survey. We did not include them in our analysis.
[5] In its July 2018 preliminary report on its mandatory inventory, Illinois EPA found that 234 utilities failed to submit a report. Even with this limit, the submitted reports covered 95% of the 3.74 million service lines in the state.
[6] Many utilities reported different numbers of total service lines in their survey response than were reported in SDWIS. We used SDWIS numbers so we have estimates for all CWSs. Also, 63 utilities appear to have improperly completed the form since the estimated total service lines did not match individual elements. This affects more than 50,000 service lines. We did not attempt to reconcile the differences.
[7] The number is based on SDWIS. The utility reported 373,532 service lines on the survey form.