When it comes to lead, formula-fed infants get most from water and toddlers from food, but for highest exposed children the main source of lead is soil and dust
Tom Neltner, J.D., is Chemicals Policy Director
On January 19, the Environmental Protection Agency (EPA) released a major new draft report proposing three different approaches to setting health-based benchmarks for lead in drinking water. We applauded EPA’s action and explored the implications for drinking water in a previous blog. One of the agency’s approaches provides useful, and surprising, insights into where the lead that undermines the health of our children comes from. Knowing the sources enables regulators and stakeholders to set science-based priorities to reduce exposures and the estimated $50 billion that lead costs society each year.
The EPA draft report is available for public comments until March 6, 2017, and it is undergoing external peer-review by experts in the field in support of the agency’s planned revisions to its Lead and Copper Rule (LCR) for drinking water. Following this public peer-review process, EPA expects to evaluate and determine what specific role or roles a health-based value may play in the revised LCR. With the understanding that some of the content may change, here are my takeaways from the draft:
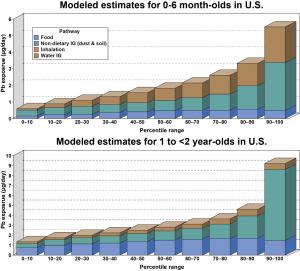
- For the 20% of most exposed infants and toddlers, dust/soil is the largest source of lead. Since we know that 21% of U.S. homes (24 out of 114 million) have lead-based paint hazards, this should not be surprising.
- For most infants, lead in water and soil/dust have similar contributions to blood lead levels, with food as a smaller source. If the infant is formula-fed, water dominates.
- For 2/3 of toddlers, food appears to provide the majority of their exposure to lead. This result was a surprise for me. EPA used data from the Food and Drug Administration’s (FDA) Total Diet Study collected from 2007 to 2013 coupled with food consumption data from the National Health and Nutrition Examination Survey collected from 2005 to 2011. In August 2016, FDA reported on levels of lead (and cadmium in food) commonly eaten by infants and toddlers based on a data set that is different from its Total Diet Study. FDA concluded that these levels, “on average, are relatively low and are not likely to cause a human health concern.”
- For all children, air pollution appears to be a minor source of lead exposure. We think it is most likely because exposure is localized around small airports and industrial sources.
For a visual look at the data, we extracted two charts from the draft EPA report (page 81) that show the relative contribution of the four sources of lead for infants (0-6 month-olds) and toddlers (1 to <2 year-olds) considered by the agency. The charts represent national exposure distributions and not specific geographical areas or age of housing.
There is no safe level of lead in children’s blood. Even low levels are likely to impair brain development, contributing to learning and behavioral problems and lower IQs. Based on data from a decade ago, lead costs society a collective 23 million IQ points and $50 billion every year. EPA’s draft analysis provides useful information to help set priorities to continue and accelerate progress in reducing childhood lead exposure.
Based on the analysis by EPA’s scientists, we conclude that reducing lead contamination in food needs to be a greater priority for FDA and with food manufacturers. Lead in paint remains a challenge, but studies show that every dollar invested yields $17 in return to society. And, as the Flint experience has shown, lead service lines can present a significant source of lead exposure.


