Is Global Clean Energy Investment at a Tipping Point?
By: Qiao Feng, Clean Energy Research Intern, and Peter Sopher, Clean Energy Policy Analyst
 Last week, amidst the U.N. Climate Summit and historic climate march, governments, investors, and financial institutions took the opportunity to make big announcements about their investment in clean energy. Bank of America announced a $10 billion initiative to speed up investment in clean energy, U.N. climate leaders announced a public-private partnership to mobilize more than $200 billion in clean energy financing globally, and New York proposed a $5 billion clean energy fund that could replace the city’s soon-to-expire renewable-energy and efficiency mandates.
So clean energy finance must be skyrocketing upward, right? It’s hard to know now what the 2014 numbers will bear, and we probably won’t see that kind of analysis till 2015, but looking at global investment in renewable power and fuels (excluding large hydro-electric projects) for 2013, these numbers were 14 percent lower than investments in 2012, and 23 percent below the 2011 record, suggesting a downward trend.
However, as conveyed in the Bloomberg New Energy Finance (BNEF) report, Global Trends in Renewable Energy Investment 2014, if the drop in renewable investment were a cloud, it would have several silver linings:
- Due to significant cost reductions, a record amount of solar photovoltaic (PV) capacity (39GW) was constructed in 2013 at a lower total cost than the 31GW in 2012.
- There was a 54 percent recovery in clean energy share prices in 2013, motivating specialist companies to raise equity on public markets.
- In 2013, onshore wind and solar PV projects were built in a growing number of locations around the world without subsidy support due to cost reductions and efficiency improvements.
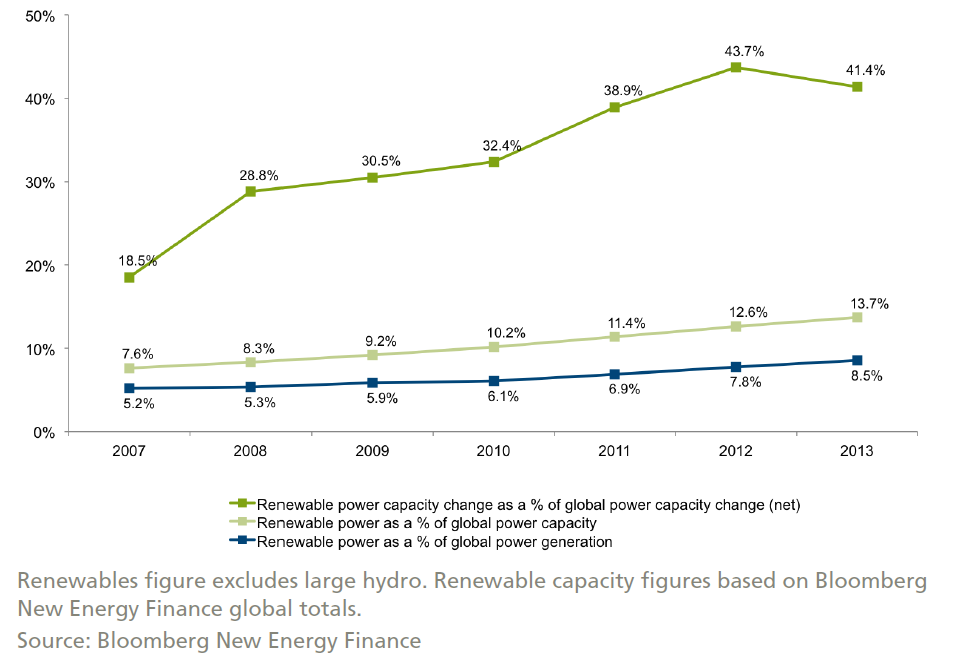
- In 2013, renewable energy (excluding large hydro) comprised 41.3 percent of new electric capacity additions and raised renewables’ share of the total electricity generation worldwide to 8.5 percent from 7.8 percent in 2012 (see line graph below). Without this contribution, global energy-related CO2 emissions would have been 1.2 billion tons higher.
- Strong market signals, such as the fact that “subsidies have been consistently reduced over recent years in every country, and this has not killed the industry,” indicate investor confidence in renewables is improving.

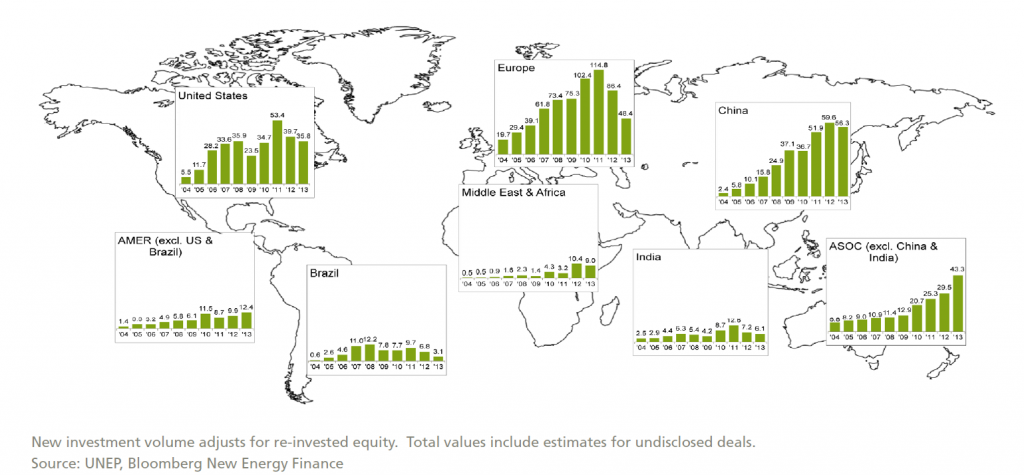
As illustrated in the figure below, U.S. clean energy investment during 2004-2013 has been bumpier in the United States than in other regions. U.S. investment reached a peak of $54.3 billion in 2011 and then dropped tremendously. As claimed by the BNEF Report, this pattern primarily reflects the expiry of the federal loan guarantee and Treasury grant programs in 2011, as well as worries about the possible expiry of the Production Tax Credit for wind.

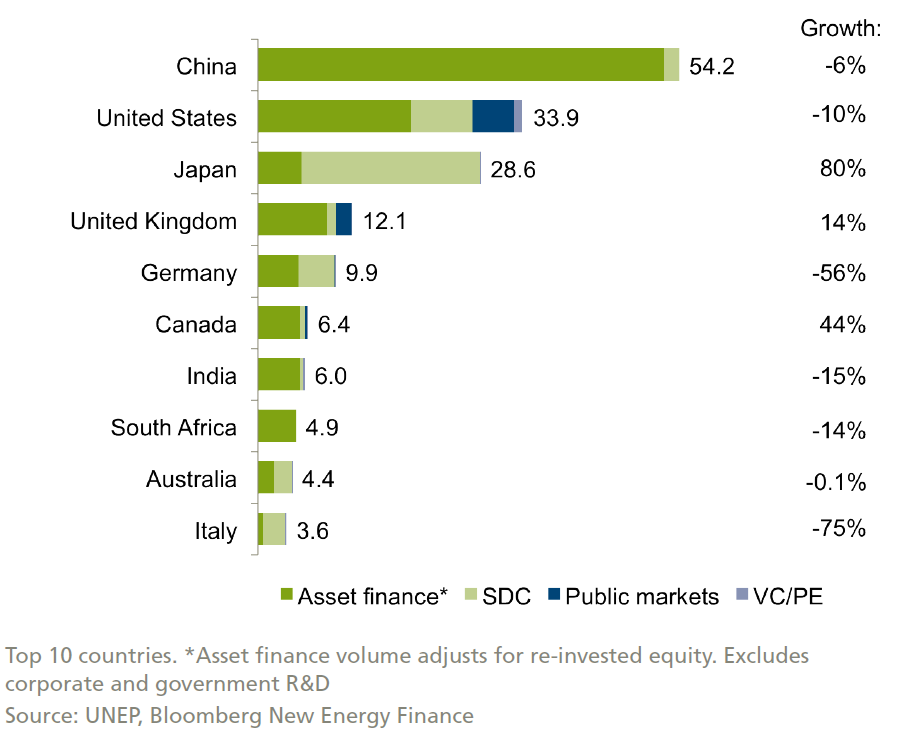
While China was again the dominant investor in renewable energy in 2013, most of the top 10 countries were developed economies. As we can see from the chart below, the U.S. was the largest investor in renewable energy among developed economies, at $33.9 billion excluding research and development.

When compared to investments in fossil fuels, renewables fared well. In 2013, fossil-fuel capacity investment also fell to $270 billion from $309 billion in the previous year, which is still much higher than the $192 billion investment in new renewable generation capacity. However, the $270 billion fossil-fuel figure is gross investment, and, according to BNEF:
…much of which [the $270 billion] went to replacing coal-, oil- and gas-fired power stations that were taken out of service or closed. What actually went into establishing additional fossil-fuel capacity, the net investment, was much lower, at just $102 billion. This was well below renewables’ gross (and net) investment of $192 billion.”
Renewable investment figures look even more favorable when they include large-scale hydro-electric capacity. As the BNEF report stated:
The amount of new large hydro capacity added in 2013 is likely to have been at least 20GW. The average capital cost, for large hydro is some $1.5 million to $2 million per MW, so that 20GW is likely to have reflected approximately $35 billion of investment. Adding that to the renewables (excluding large hydro) figure of $192 billion in 2013 would produce an all-renewables total of $227 billion, which is below the gross fossil-fuel investment figure of $270 billion, but far above the net fossil-fuel tally of $102 billion.”
Highlights of global clean energy investment in 2013 include record solar PV installations, decreased use of subsidy support for renewables, improved investor confidence, and an arguably better overall performance than that for fossil fuel investments. While there was a dip in total clean energy investment in 2013, the many positive takeaways from Global Trends in Renewable Energy Investment 2014 indicate the upward trends from the past decade, both in the U.S. and globally, promise to continue.


