EDF Health

Selected tag(s): Lead service lines

Lead Pipe Replacement: EPA changes state shares of funding

Lindsay McCormick, Senior Manager, Safer Chemicals, Tom Neltner, Senior Director, Safer Chemicals and Roya Alkafaji, Manager, Healthy Communities

What Happened?

Earlier this month, EPA announced an updated formula it will use to allocate federal funds for lead service line (LSL) replacements. This new formula will be based on each state’s expected needs, as determined by a 2021 survey of state and water utility estimates.

Why It Matters

EPA’s distribution of the first of five years of the historic $15 billion dedicated to LSL replacement from the Infrastructure Improvement and Jobs Act (IIJA) was not necessarily going to states and communities that needed it most.

Many water utilities rely on the State Revolving Fund (SRF) program to build and maintain their drinking water infrastructure. EPA funds SRF programs each year and their previous formula to determine allocations was based on a 2015 survey of estimated drinking water infrastructure funding needs including LSL replacement – putting populous states like California at the top of the list. However, a 2016 article by the American Water Works Association (AWWA) showed LSLs are most heavily concentrated in the Midwest and Northeast, in states like Illinois, Ohio, Michigan, Missouri, New York, and New Jersey.

With EPA’s new formula, each state’s need, based on its estimated number of LSLs, will be used to distribute the next four years of IIJA funding for LSL replacement. This is a critical step to ensure that the system for distributing federal funds is functioning equitably and funds go to those communities with the greatest needs.

Projected Number of Lead Services Lines by State–2023

But wait…what’s going on in Florida and Texas?

When we dug into the details, there was one surprise in particular. Florida’s level of funding has increased a whopping 228%, based on a new estimate that the state has 1.2 million LSLs – more than any other state – and that about one in every six of its service lines is an LSL. Based on the age of infrastructure in the state, we think that this number is a gross overestimate. If we’re right, other states will get shorted on their share of LSL-replacement funding.

At first blush, data from Texas also caught our eye. The state reported almost 650,000 LSLs – up from 270,000 in the AWWA survey. But in contrast to Florida, this means Texas is claiming that only 5% of all its services lines are LSLs. Overall, Texas’ funding under the new formula will decrease by one-third.

What’s Next?

Starting this federal fiscal year (October 1, 2023), states will receive their new allocations of IIJA funding for LSL replacement. We’ll continue to monitor the funding flowing into each state for the critical task of getting the lead out, especially in communities that need it most. For states like Florida that may be in line for more than their fair share, we’ll be monitoring where those dollars are going.

Want to learn more?

Check out EPA’s detailed factsheet: 7th Drinking Water Infrastructure Needs Survey and Assessment

Posted in Mapping Lead, Public health / Also tagged , , , , | Authors: / Comments are closed

Rhode Island expects LSL replacements to be ‘simultaneous and complete’ when funded by SRF

Tom Neltner, Senior Director, Safer Chemicals Initiative
and
Roya Alkafaji, Manager, Healthy Communities

What Happened: The Rhode Island Department of Health (RIDOH) published notices on January 18 and January 30 indicating that Providence Water would need to stop partial replacement of lead service lines (LSLs) when the work is funded by the State Revolving Fund (SRF) program.

RIDOH specified that “only [LSL] replacement that results in simultaneous and complete replacement of both the public (water main to curb stop) and private (curb stop to water meter inside buildings) portions of the lead service lines will occur.”

Why It Matters: EPA made it clear in its FAQs that federal SRF funds should not be used to support harmful partial LSL replacements, which increases the risk of lead exposure in drinking water.[1] To our knowledge, Rhode Island is the first state that has applied its National Environmental Policy Act (NEPA)-like environmental review process to protect residents from partial LSL replacements by requiring the simultaneous and complete replacement of an LSL. All states have a similar review process pursuant to EPA requirements and should be taking similar action.

Our Take: RIDOH’s determination is an important application of the state’s environmental review requirements for its SRF program. We strongly supported RIDOH’s action in comments. We also asked that it be applied to six other SRF-funded projects that are likely to disturb LSLs, like water main replacement and asked for a public hearing if RIDOH allows partials for those other projects.

The Backstory: EDF objected to RIDOH’s March 2022 proposal to grant Providence Water a categorical exclusion that would have allowed partial LSL replacements. We reasoned that the practice would “disproportionately and adversely affect the health of low-income, Black, Latinx, and Native American residents by increasing their risk of exposure to lead in drinking water.” Accordingly, the utility was not eligible for a categorical exclusion and must either stop partial LSL replacements or conduct a full environmental review. This review would likely demonstrate the project was not eligible for funding.

Later, RIDOH withdrew the proposal based on follow-up discussions with EDF and separate discussions with Childhood Lead Action Project.

Go Deeper: Read RIDOH’s April 2022 and January 2023 public notices, a related civil rights administrative complaint filed with EPA, and EDF’s objections to RIDOH’s April 2022 proposal.


[1] EPA Frequent Questions about Bipartisan Infrastructure Law State Revolving Funds and LSLR:

Question 4. If some customers (e.g., homeowners) refuse to allow the water utility access to replace the privately-owned portion of the lead service line, does this affect the project’s DWSRF funding?

State DWSRF programs may still fund the overall project but are strongly encouraged to use technical assistance and other outreach methods to achieve the fullest possible participation. If the customer continues to refuse access, then the water system should leave the publicly-owned portion of the lead service line in place (so as to not create a partial replacement) and document this action. To be clear, partial service line replacements are not eligible for DWSRF funding (from any DWSRF funding source).”

Posted in Civil rights / Also tagged , , , , | Comments are closed

Mapping Lead: Powerful tool helps communities find underground hazards

Roya Alkafaji, Manager, Healthy Communities and Tom Neltner, Senior Director, Safer Chemicals Initiative

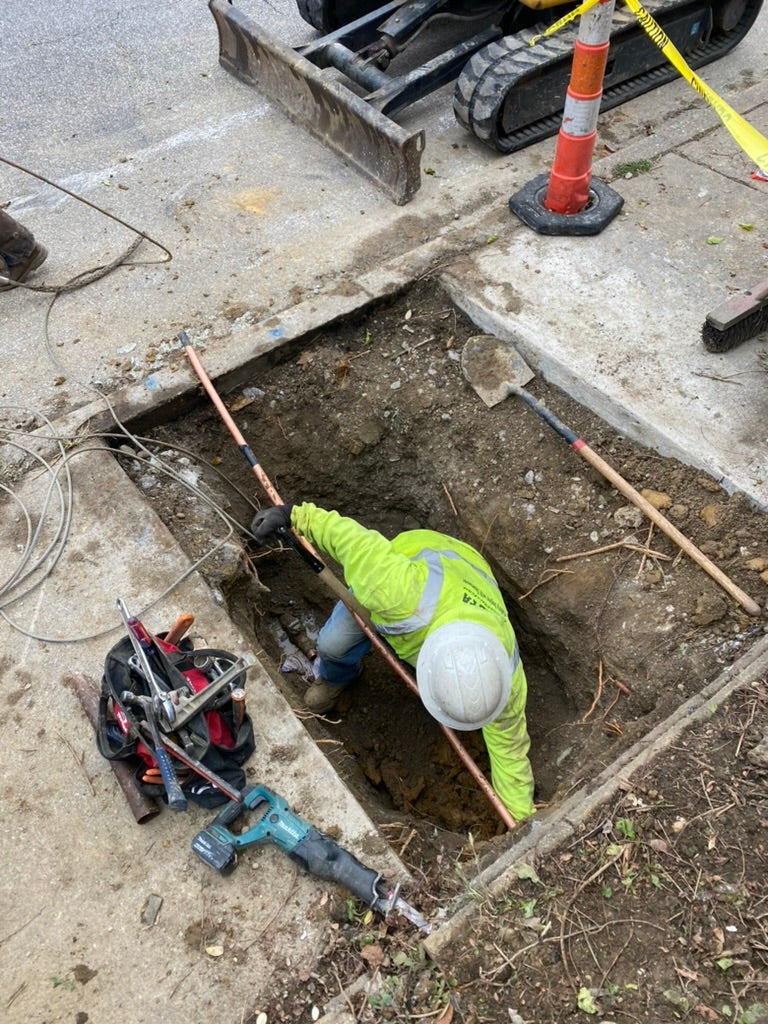
We have all come to expect access to information at our fingertips. To meet this demand, water utilities are increasingly posting interactive maps online to help residents identify whether their homes are connected to lead service lines (LSLs).[1] These are the pipes that deliver water from the main under the street to homes and buildings. In homes built before 1986, this pipe could be made of lead.

With this information, people can:

  • Better assess their risk of lead exposure from drinking water and take steps to reduce possible exposure (e.g., water filters);
  • Make decisions when renting or purchasing a new home, and/or;
  • Demand that their water utility and community invest in effective LSL replacement programs to reduce harmful exposure to lead, particularly for children who are most vulnerable.

Given the importance and growing popularity of LSL maps, we are launching a new blog series, Mapping Lead, that will explore how utilities are approaching maps, evaluate which map features are most and least effective, and share best practices to help guide future efforts.

EPA recognized the value of interactive maps in its August 2022 guidance on developing service line inventories. The agency recommended utilities of all sizes consider making information available through interactive maps using commonly available tools, like GIS software. The guidance references EDF’s 2019 study for evidence of the power of these interactive maps and spotlights LSL replacement programs in Cincinnati and Denver as examples of best practices.[2]

We wholeheartedly agree with EPA’s recommendations. As a result of the agency’s guidance, we anticipate that the number of online maps is likely to grow dramatically as utilities meet an October 2024 deadline to make their inventory of service line materials publicly accessible to comply with EPA’s revised Lead and Copper Rule (LCR).

Top 100 Cities: Who Has Maps – And Who Doesn’t

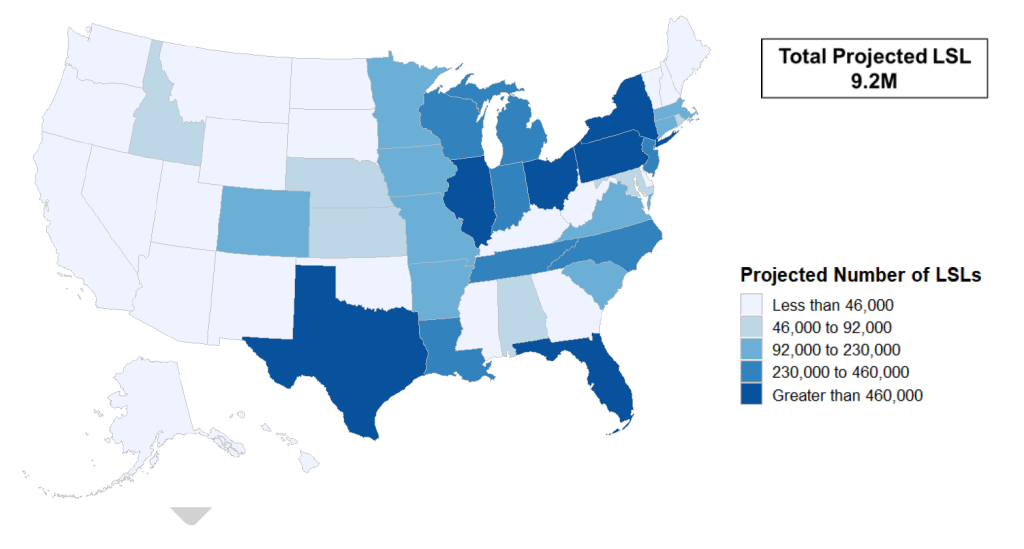
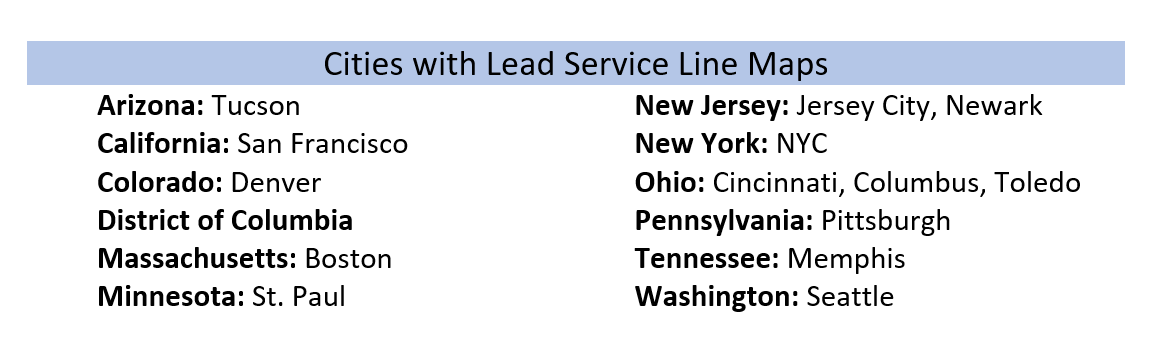
We identified over 50 interactive LSL maps that utilities have made publicly available to residents across the United States. Looking at the utilities that serve the 100 largest cities in the country, we found that 15 have LSL maps—a positive step that leverages existing asset-management tools such as GIS, while increasing public transparency. Together, these 15 utilities provide drinking water to more than 16 million people.

Throughout this blog series we’ll take a closer look at maps; in some cases, we’ll be critical of those that don’t meet the criteria for an effective map. Nonetheless, we recognize these utilities have taken a step in the right direction and should be applauded for their efforts.

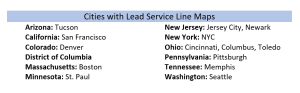
We discovered that 12 large utilities were notably absent from the list of those with online maps. Given their size and location, these utilities presumably have LSLs in their distribution areas and the in-house resources to develop effective maps. We hope that by shining a light on the cities that are leading the way and addressing the contrast with those cities without maps, we can help spur action so residents of large cities served by these utilities will have access to this crucial information. For a list of the 12 utilities without maps and 15 with maps, see the tables below. We’ll continue to revise these lists as more large cities publish interactive maps online.

By the Numbers

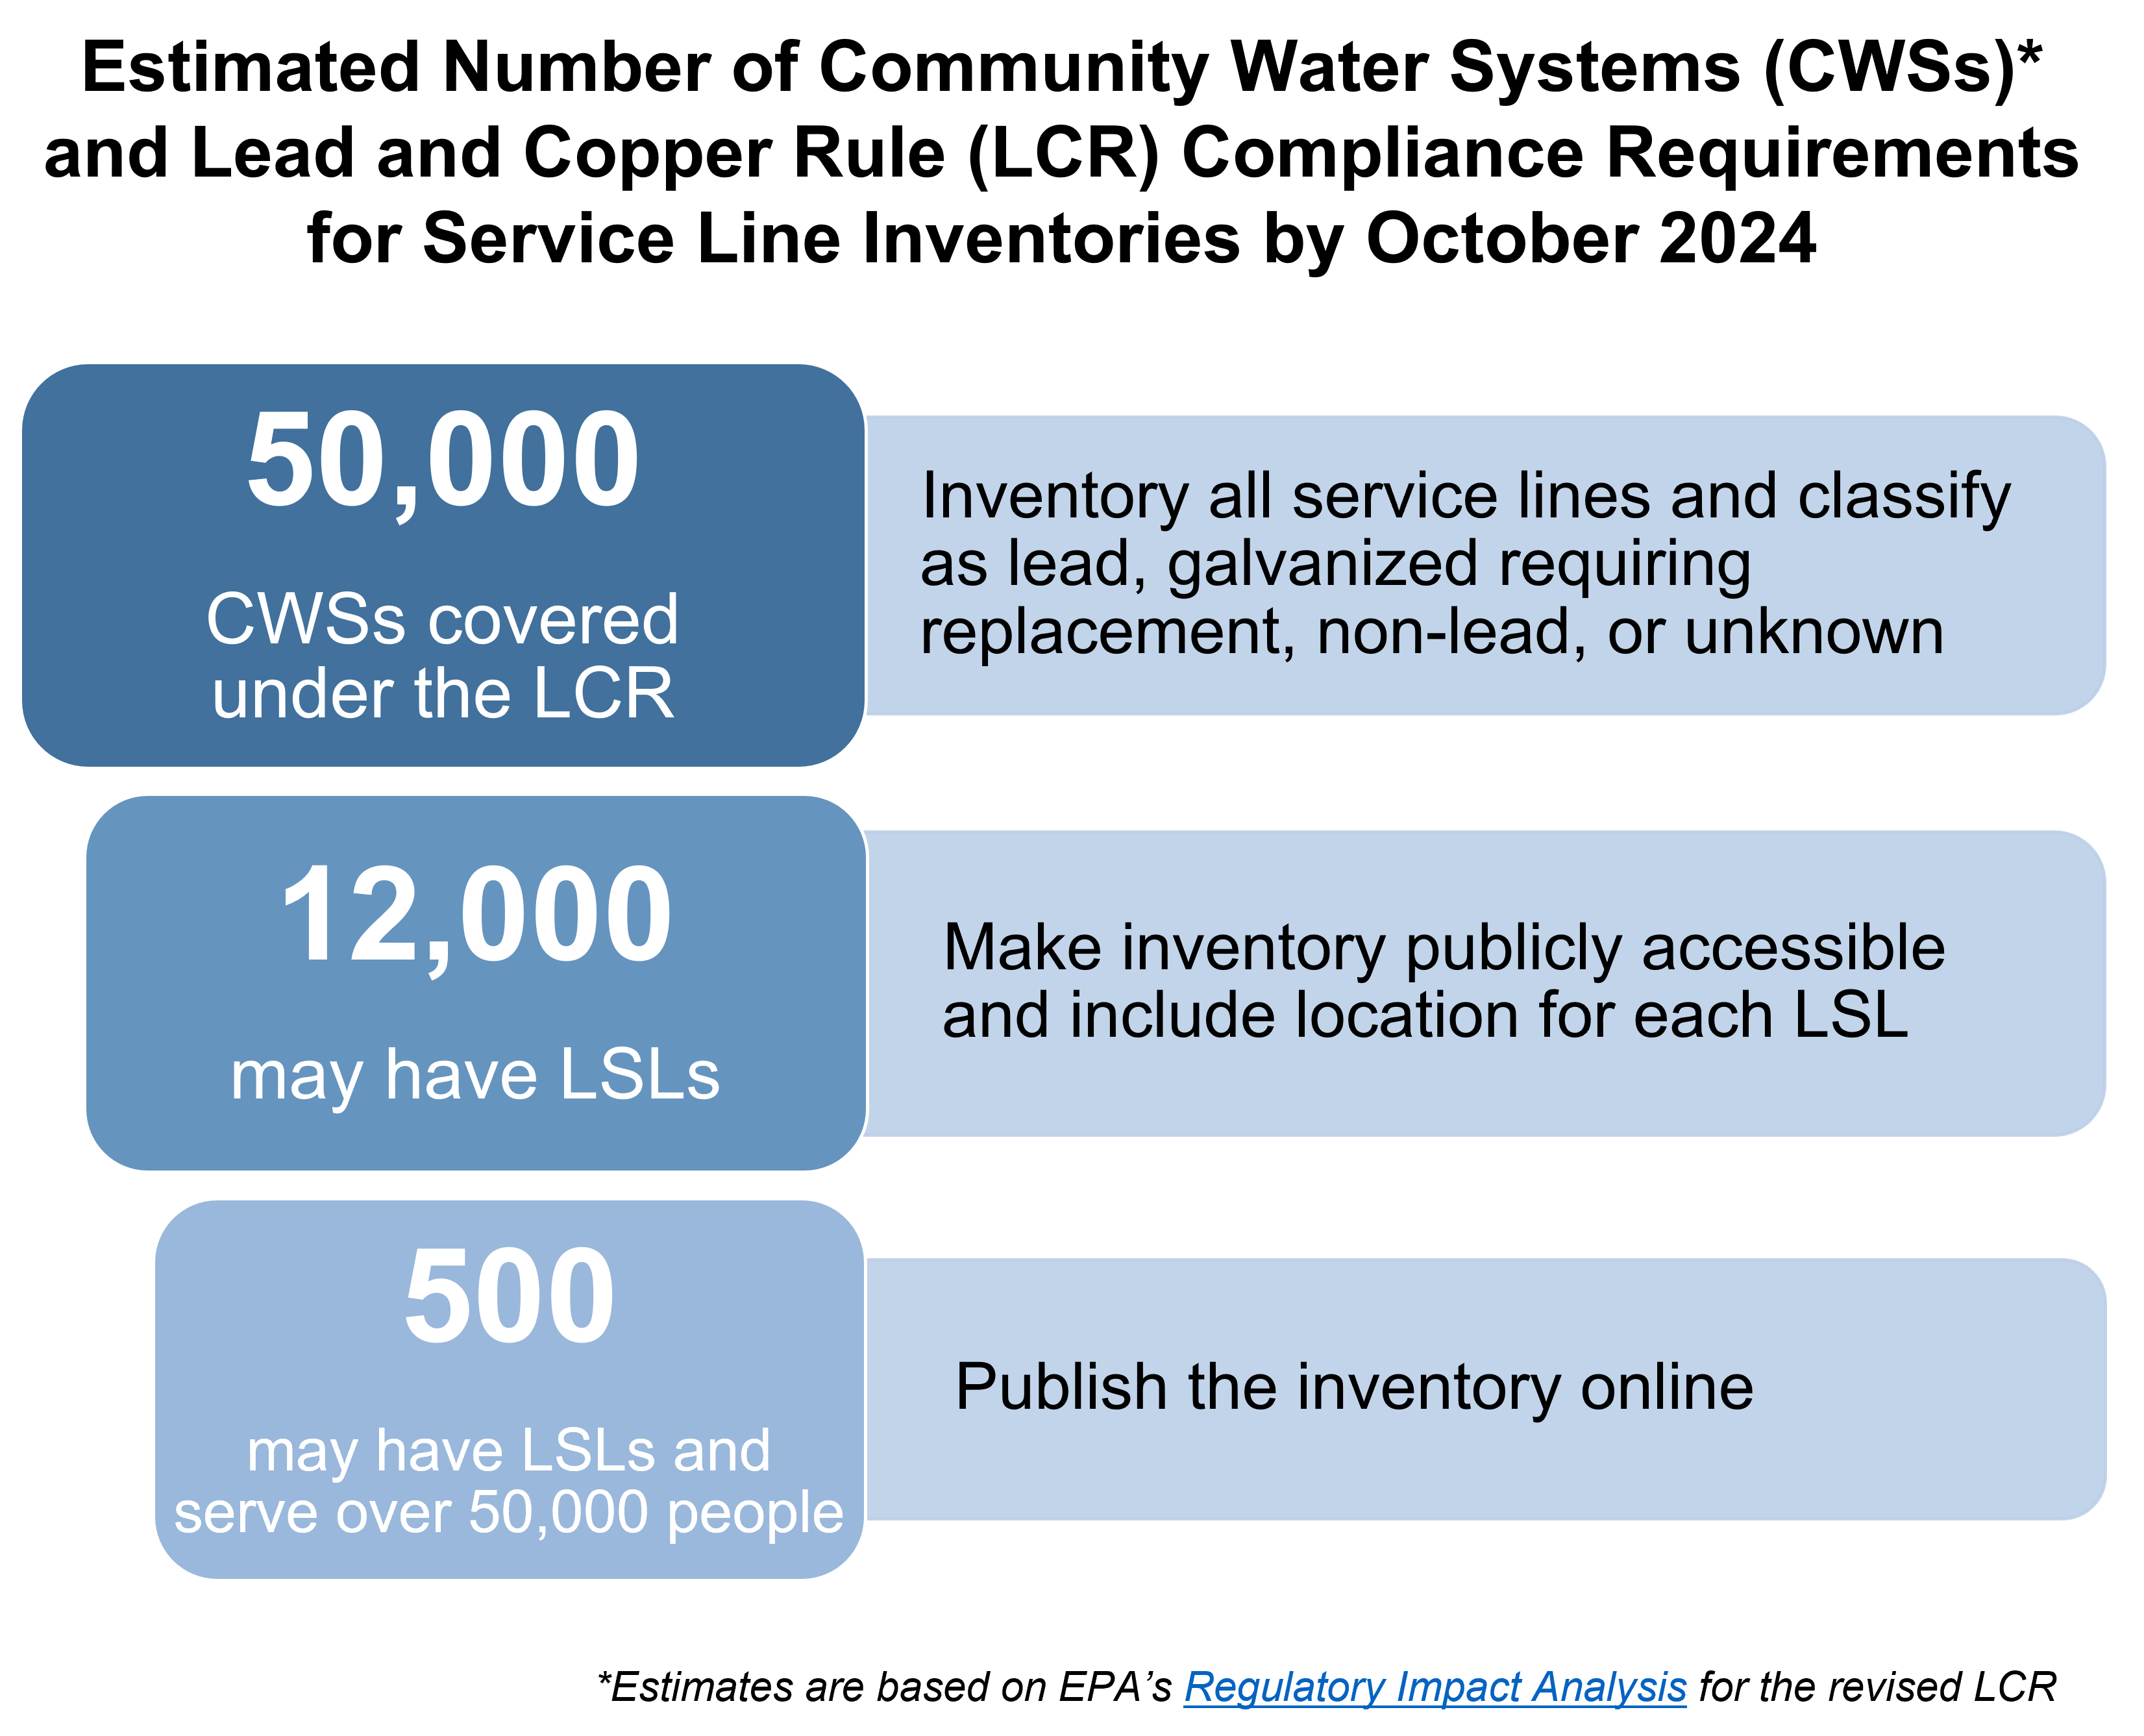
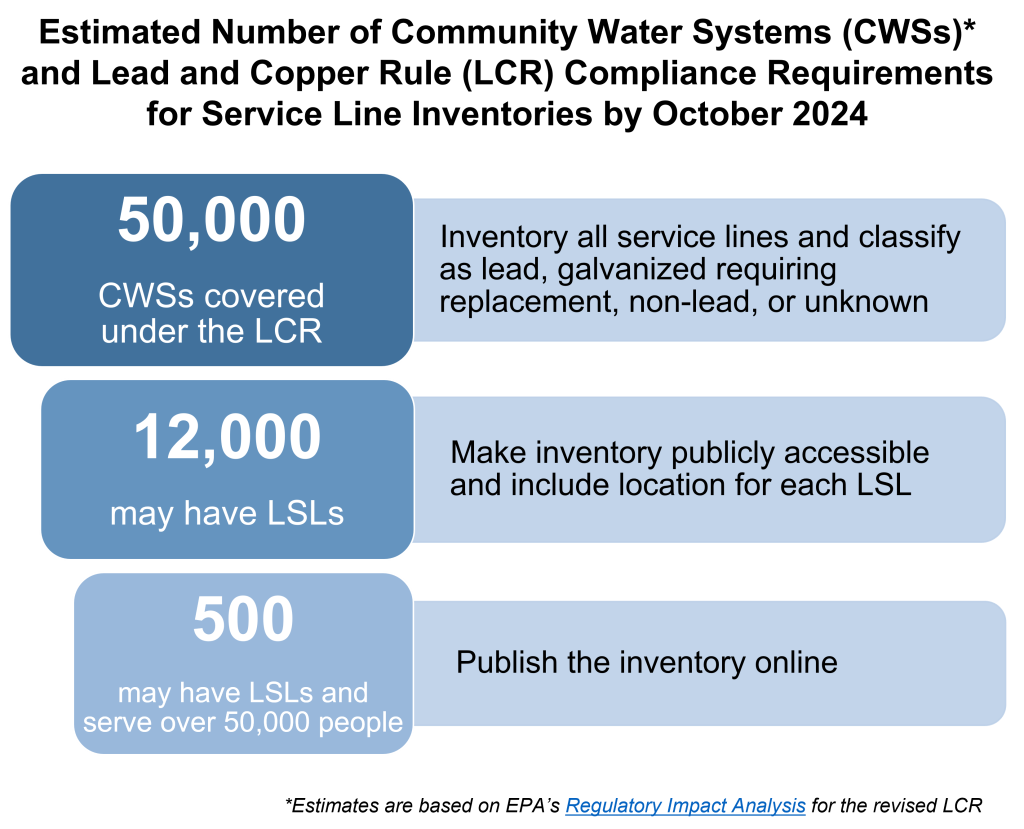
It’s important to understand the broader landscape as we track cities that are choosing interactive maps as a key tool for communicating about LSLs to the public. Using estimates from EPA’s Regulatory Impact Analysis for the revised LCR, the figure below shows the number of community water systems that fall under the purview of the LCR and subsequent requirements based on presence of LSLs and population served.

By October 2024, more than 50,000 utilities[3] will either submit an initial service line inventory or demonstrate the absence of LSLs in their distribution area.[4] EPA estimates that more than 12,000 utilities will find LSLs and thus will be required to make their inventory publicly accessible; those that serve over 50,000 people will also be required to post the inventory online.

More to Come

Follow along as we explore interactive maps and the role they play in LSL replacement.

Utilities Serving Top 100 Largest Cities With Online Interactive Maps

UtilityPopulation Served†Estimated # of LSLs‡
New York City, New York (Map)8.3 million360,000
Boston, Massachusetts (Map)2.6 million3,900**
Denver, Colorado (Map)1.4 million64,000**
Columbus, Ohio (Map)1.3 million28,000*
Seattle, Washington (Map)956,0002,000*
San Francisco, California (Map)884,0001,600*
Cincinnati, Ohio (Map)750,00040,000
Memphis, Tennessee (Map)700,00014,000*
Tucson, Arizona (Map)675,000600
Washington, D.C. (Map)632,00042,000**
Pittsburgh, Pennsylvania (Map)520,00016,000**
Toledo, Ohio (Map)480,00030,000**
St. Paul, Minnesota (Map)400,00027,000
Newark, New Jersey (Map)295,00024,000**
Jersey City, New Jersey (Map)262,00016,000
*Map and/or estimated number of LSLs reflects public side only.
**Active or completed LSL replacement program. The number listed reflects the estimated number of LSLs prior to the start of the program.
†Source is SDWIS, 2022.
‡Source available upon request.


Select Utilities Serving Top 100 Largest Cities That Lacked Online Interactive Maps

UtilityPopulation Served†Estimated # of LSLs‡
Chicago, Illinois2.7 million380,000
Baltimore, Maryland1.6 millionNot reported
Philadelphia, Pennsylvania1.6 million20,000
Cleveland, Ohio1.3 million200,000
Charlotte, North Carolina1.1 millionNot reported
Indianapolis, Indiana (Citizens Energy – Water)837,00055,000-75,000
Nashville, Tennessee722,000Unknown
Detroit, Michigan714,00080,000
Milwaukee, Wisconsin590,00066,000
Omaha, Nebraska554,00016,000-17,000
Minneapolis, Minnesota424,00049,000
New Orleans, Louisiana291,000Unknown
†Source is SDWIS, 2022.
‡Source available upon request.


[1] For this blog series, LSLs includes service lines that are “galvanized requiring replacement” per 40 CFR § 141.2.

[2] See Section 7.2 of EPA’s service line inventory guidance.

[3] For purposes of this blog series, community water suppliers as defined by EPA are referred to as utilities.

[4] Per 40 CFR 141.84(4), CWSs must categorize each service line, or portion of the service line where ownership is split, as lead, galvanized requiring replacement, non-lead, or lead status unknown. In order to declare that the system only contains non-lead service lines, this must be “determined through an evidence-based record, method, or technique.”


Revised May 2, 2023 to update blog series title and link.

Posted in Drinking water, Lead, Mapping Lead / Also tagged , , | Authors: / Comments are closed

EPA greenlights 21 states’ SRF plans to fund LSL replacement projects

Tom Neltner, Senior Director, Safer Chemicals

What’s New: EPA announced it has awarded $1.16 billion to the State Revolving Fund (SRF) programs in 21 states, the District of Columbia, and three territories to support lead service line (LSL) replacement projects. In order to secure funding, these states developed and submitted Intended Use Plans (IUPs), which included LSL replacement projects that met EPA’s requirements.

Why It Matters: These 25 programs can now begin distributing their share of the first of five years of funding from the $15 billion Congress included in the 2021 Infrastructure Investment and Jobs Act (IIJA) specifically for full LSL replacement projects. The remaining states are working to get their IUPs submitted to EPA.

Read More »

Posted in Drinking water, Lead, Public health / Also tagged , , , , , | Comments are closed

The LSLR Collaborative’s new guide helps communities design equitable lead service line replacement programs

Guest post from Mason Hines, Mediator with RESOLVE and Facilitator for the Lead Service Line Replacement Collaborative.  See the original post here.

For over six years, RESOLVE has convened the Lead Service Line Replacement Collaborative, a joint effort of 28 national public health, water utility, environmental, labor, consumer, housing, and state and local governmental organizations to accelerate full removal of the lead pipes providing drinking water to millions of American homes.

A guiding principle of the LSLR Collaborative is that lead service line (LSL) replacement program should consider and address barriers to participation so that people served by LSLs can benefit equitably, regardless of income, race, or ethnicity. Questions of equity surface at many points in the design of LSL replacement programs, including determining how replacements are funded, how to sequence replacement schedules, and how the program is communicated to community members.

Understanding these are important and complex questions, the LSLR Collaborative recently released a step-by-step guide communities can use to help consider and account for issues of equity when developing LSL replacement programs.  Read More »

Posted in Drinking water, Lead, Public health / Also tagged , , , | Comments are closed

Leveraging LSL replacement funding: Chicago Fed steps up

Tom Neltner, Senior Director, Safer Chemicals Initiative

The Federal Reserve Bank of Chicago serves Iowa and much of Illinois, Indiana, Michigan, and Wisconsin—areas of the country that likely have more LSLs than those served by any of the other 11 banks in the Federal Reserve System. Image source: Federal Reserve Bank of Chicago

What Happened: On November 2, the Federal Reserve Bank of Chicago held a meeting of more than 50 stakeholders interested in new strategies to fund and finance lead service line (LSL) replacements. I attended, representing the Lead Service Line Replacement Collaborative.

Why It Matters:

  • The meeting was an important first gathering of its type to focus on helping:
  • Lead pipes represent the most significant source of lead in drinking water. Replacing the nation’s estimated 9 million LSLs is predicted to cost $45 billion.
  • Federal funds alone will not be enough to help states and communities eliminate this lead pipe legacy, municipal water utilities need to leverage federal funds by getting the lowest rates for bonds to finance their efforts.

Our Takeaway: EDF applauds Chicago Fed for its leadership in taking on this complicated but critical issue. The meeting advanced the discussion in a way that only a neutral party like the Chicago Fed can do.

Next Steps: Within days of the convening, I am already hearing from participants interested in making connections or learning more about the issue. Chicago Fed should continue these convenings and engage more stakeholders.

Go Deeper: In February 2022, staff at the Chicago Fed began to offer a series of excellent articles, videos, and case studies to explain the issue of lead pipes to their stakeholders. We recommend this interview with Margaret Bowman, a water expert with 30 years in the nongovernmental and philanthropy sectors, as she explains the financing needs and opportunities.

Posted in Drinking water, Lead, Public health / Also tagged , , , , , , | Comments are closed