EDF Health

Selected tag(s): Hyperlocal mapping

Pandemic exposes need for cities to improve air pollution data collection to protect public health

Harold Rickenbacker, Ph.D., Manager, EDF+Business.

This is the fourth in a series of Global Clean Air blogs on COVID-19 and air pollution. EDF scientists and program experts share data about pollution levels during quarantine from a local and global perspective, and provide recommendations for governments and companies to Rebuild Better.

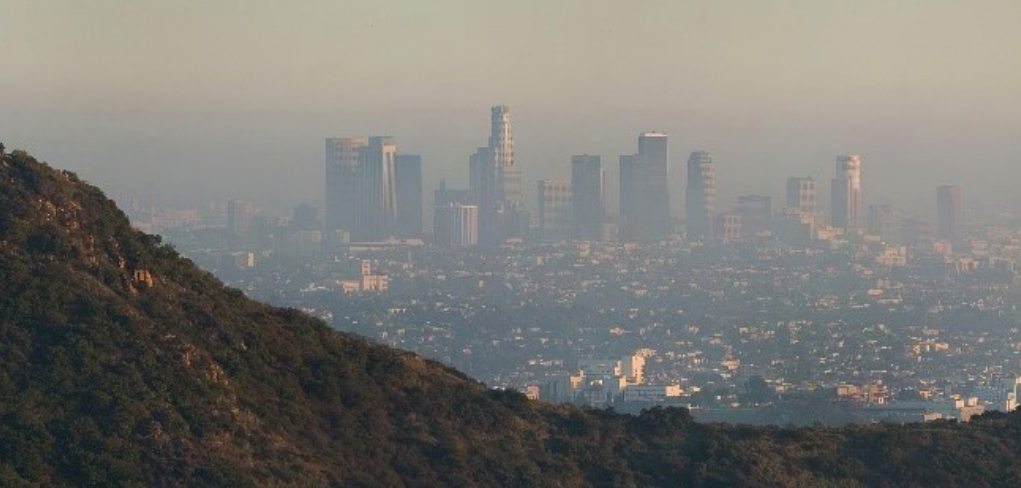
Los Angeles, California. 

We’ve long known that air pollution is linked to health problems like heart disease and asthma, and that these risks are highest for the elderly and people with existing heart and lung diseases. Now, new evidence shows the same people who have lived with polluted air for decades are also at increased risk for severe illness from Coronavirus.

These findings are generating unprecedented urgency to clean the air we breathe and underscoring the importance for cities across the globe to make air pollution monitoring a priority in a post-pandemic world.

But as local leaders grapple with how to tackle air pollution and protect vulnerable communities, they’re faced with a big challenge: they lack the localized data needed to properly protect public health and reduce harmful emissions.

New, lower-cost sensor technology is allowing scientists, advocates and government officials to map air pollution at the hyperlocal level, which can reveal pollution patterns within neighborhoods and even individual city blocks.

Policymakers tasked with rebuilding healthier and more resilient communities in a post-pandemic world can use localized data to work more effectively with residents and stakeholders to implement powerful interventions that reduce air pollution in overburdened communities.

Read More »

Posted in Air pollution, Hyperlocal mapping / Also tagged | Comments are closed

How new data is helping West Oakland clear the air

Fern Uennatornwaranggoon is EDF’s Air Quality Policy Manager.

Community groups are using California’s first-of-its-kind Community Air Protection Plan to reduce pollution in the city’s most impacted areas.

The fight for healthier air in West Oakland spans generations. Just Ask Ms. Margaret Gordon, who has been at it since 1992. “I’ve had 16 grandchildren and one great-grandchild since then,” says the co-director of the West Oakland Environmental Indicators Project (WOEIP). Two years ago her community’s efforts got a much-needed boost: California passed AB 617, establishing a program requiring the state to reduce air pollution in those areas most impacted. Under the Community Air Protection Plan, community groups, environmental organizations, industry and local air districts work with the California Air Resources Board (CARB) to develop improvement plans.

Ms. Margaret, who has been an integral part of West Oakland’s efforts, tells EDF’s Fern Uennatornwaranggoon how the plan unfolded and how data gathered from Google Street View cars fed into its development.

Fern: Why did CARB turn to WOEIP to facilitate the community air plan?

Ms. Margaret: We were asked, because of the work we have done over the last 25 years on air quality. We had demonstrated our capacity to participate technically with the air district staff. In 2015 and 2016, we started doing the air monitoring with EDF, Google, the University of Texas and Aclima, and we also deployed 100 sensors with UC Berkeley throughout West Oakland for the 100×100 project.

Read More »

Posted in Air pollution, Hyperlocal mapping / Also tagged , | Comments are closed

Wearable sensors drive demand for cleaner air

Tasha Kosviner, Environment Writer/ Editor

This blog originally appeared on Medium.

Brooklyn Bridge

Most Fridays, my eight-year-old son and I take a walk. Our route takes us across some of the busiest traffic intersections in Brooklyn. As we walk, we talk. My son has lots to say and he bounces from topic to topic in funny and unexpected ways. This being New York, we often have to shout over the sound of car horns, sirens and buses roaring away from curbs.

Earlier this year, our conversation centered around the little white gadget clipped to my bag. Known as an AirBeam, it was personal air quality monitor, able to sense and measure the pollution in the air around us as we walked. The data it gathered was fed, via Bluetooth, to an app on my phone, giving us real time information about what was in the air we were breathing. What we saw was sobering.


With increasing global concern about air pollution, the availability of, and interest in, wearable air quality monitors has accelerated in recent years. In addition to the AirBeam, there is now also the Tzoa, the Flow, the ATMOtube, the CleanSpace Tag. A quick search of crowdfunding sites like Kickstarter and GoFundMe reveals multiple new monitors under development all claiming to give us the lowdown on what’s in the air around us.

Many of these gadgets stream their measurements straight to your smartphone. The AirBeam uses an open-source platform, AirCasting, and the information appears in ever evolving graphs which dip and peak as you move through space and time.

For most of mine and my son’s Friday walk, the lines remained reassuringly green and steady. But as we crossed a bridge above the Brooklyn-Queens Expressway, with traffic flying beneath our feet, the PM2.5 line (so-called because the particles detected are less than 2.5 micrometers in diameter, or one-thirtieth the size of a human hair) suddenly spiked and turned a traffic light red. We stood together and watched it silently for a few seconds.

“What does it mean?” my little boy asked.

I hesitated. The air around us looked clear, the sun shone, the people looked the same. Whatever was happening in the air above that expressway, New York (no surprise here!) didn’t seem to care. Staring at that red line, I realised I didn’t really know what it meant either. Could we stay and safely breathe that air? How long before it started to affect our health? A minute? A week? A year? I did that parent thing and answered without really answering.

“It means we’re moving on,” I tell him. “Let’s walk.”

Read More »

Posted in Air pollution, Hyperlocal mapping / Also tagged , | Read 2 Responses

What dense sensor networks can teach us about air pollution

Maria Harris is an Environmental Epidemiologist.

It all started with a challenge in 2013: how to engineer pollution-sensing balloons. Thomas Kirchstetter, Adjunct Professor at the University of California, Berkeley and the Director of the Energy Analysis and Environmental Impacts Division at Lawrence Berkeley National Lab, wanted to attach pollution sensors to high altitude weather balloons to measure how black carbon moves throughout the atmosphere.

Black carbon “soot” is emitted from diesel engines on trucks, locomotives, and ships, as well as from wildfires and the combustion of solid fuels for cooking and heating. But available technology to measure this air pollutant wasn’t well suited to handle the changes in temperature and humidity experienced during its ascent through the atmosphere or affordable enough to scale. So, he and Berkeley graduate students Danny Wilson and Julien Caubel researched what it would take to create their own.

Meanwhile, Kirchstetter had been in touch with Joshua Apte, assistant professor at the University of Texas at Austin, about his work leading Environmental Defense Fund’s mobile pollution monitoring study using Google Street View cars to measure air quality in Oakland. Apte asked Kirchstetter to support the team’s analysis as they examined how pollution concentrations varied from block to block—including black carbon. That’s when a lightbulb went off for Kirchstetter.

Read More »

Posted in Air pollution, Hyperlocal mapping, Public health / Also tagged , | Comments are closed

Traffic pollution causes 1 in 5 new cases of kids’ asthma in major cities: How data can help

Dr. Ananya Roy is a Senior Health Scientist

[pullquote]

City leadership can ill afford to ignore this issue and must strive for opportunities to prevent new cases of asthma.

[/pullquote]

landmark new study shines a light on the massive impact of vehicular air pollution on the health of our children. The study estimates that nitrogen dioxide (NO2) – a key traffic air pollutant – leads to approximately 4 million new asthma cases in children across the globe, or 1 in 10 new cases.

To address this pervasive threat, leaders need local data to create targeted approaches and policies. That’s why Environmental Defense Fund (EDF) is leveraging sensor technology to develop novel methods to measure and map air pollution – including NO2 concentrations – block by block in cities across the world, from Oakland to Houston to London.

Cities bear the worst burden

The study, released this month in The Lancet Planetary Health, finds that children living in cities are most at risk of asthma due to NO2 pollution. A staggering 90% of all new cases due to traffic were in urban and adjoining suburban areas.

Read More »

Posted in Air pollution, Health science, Hyperlocal mapping, Public health / Also tagged , | Comments are closed

Data visualization to drive clean air innovation and improve health

Aileen Nowlan, Senior Manager, EDF+Business

The first time I spoke at a conference about air pollution, the venue was right beside a daycare—a well-regarded chain, no doubt with significant waiting lists. But on the outside, the facility was steps from onramps to a bridge and a major highway, where horns blared and buses and trucks idled at the lights.

The pollution around this daycare was invisible, but because there is still so much we don’t know about air pollution, so were many of the risks.

Read More »

Posted in Air pollution, Health science, Hyperlocal mapping / Also tagged , , | Read 1 Response