What dense sensor networks can teach us about air pollution
Written By
Share
Maria Harris is an Environmental Epidemiologist.
It all started with a challenge in 2013: how to engineer pollution-sensing balloons. Thomas Kirchstetter, Adjunct Professor at the University of California, Berkeley and the Director of the Energy Analysis and Environmental Impacts Division at Lawrence Berkeley National Lab, wanted to attach pollution sensors to high altitude weather balloons to measure how black carbon moves throughout the atmosphere.
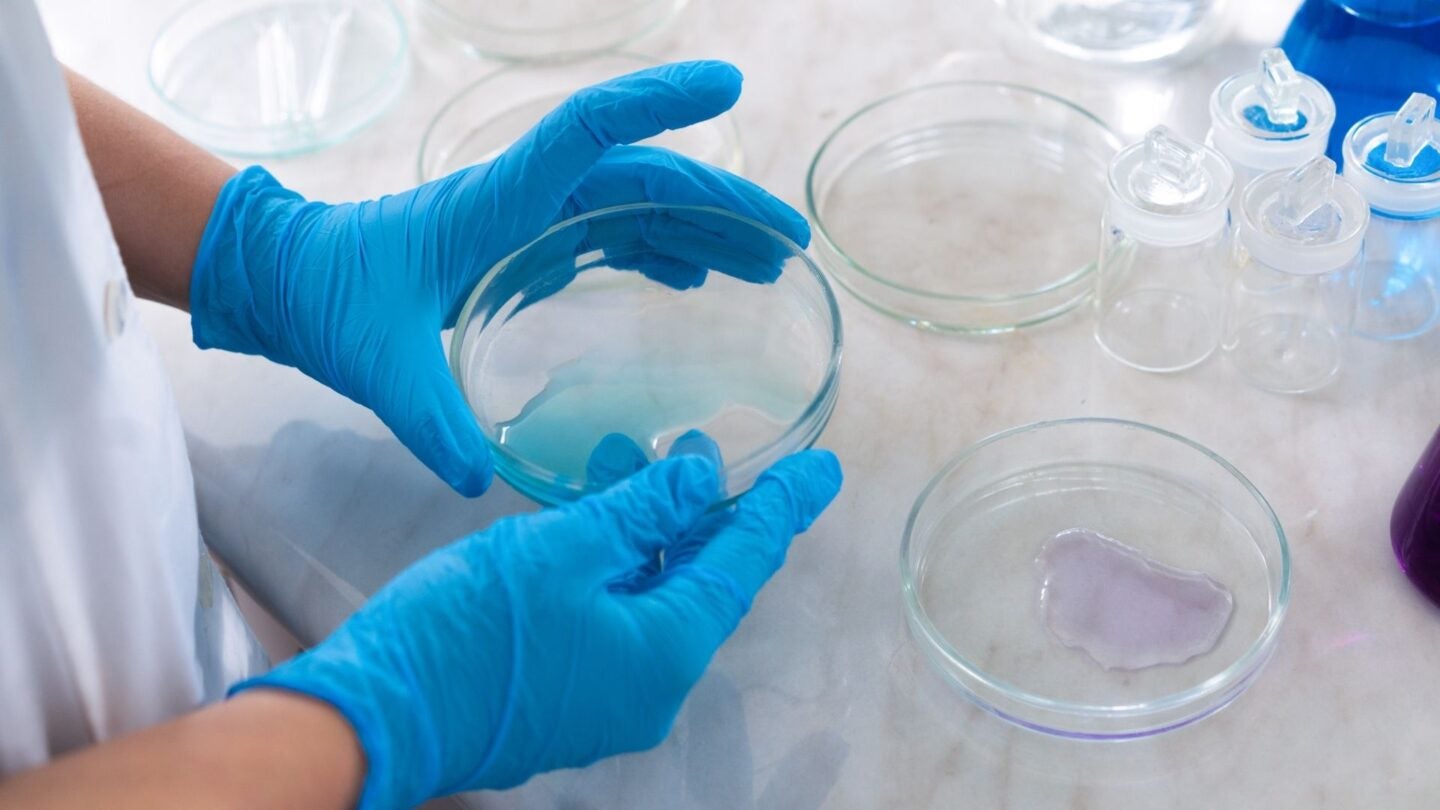
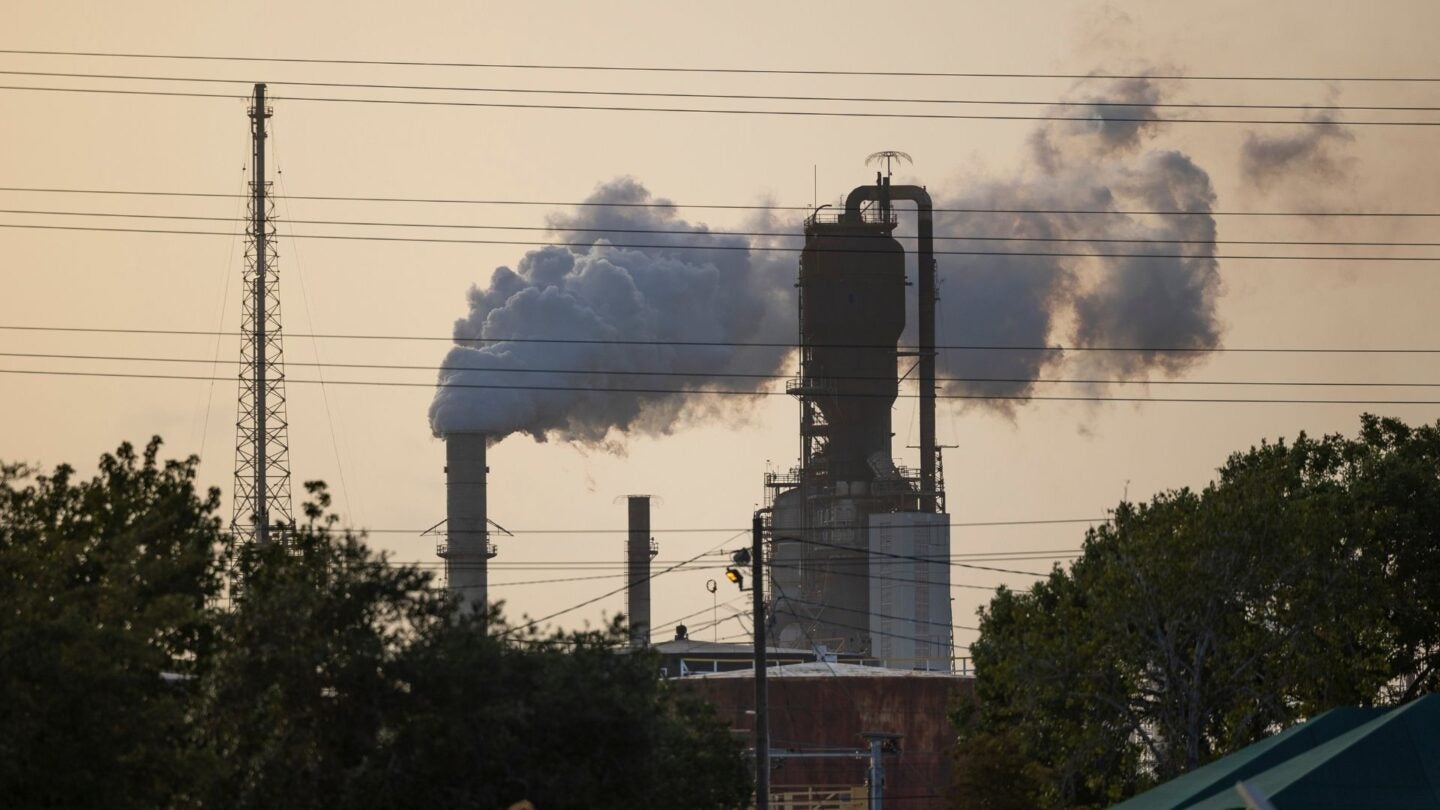
Black carbon “soot” is emitted from diesel engines on trucks, locomotives, and ships, as well as from wildfires and the combustion of solid fuels for cooking and heating. But available technology to measure this air pollutant wasn’t well suited to handle the changes in temperature and humidity experienced during its ascent through the atmosphere or affordable enough to scale. So, he and Berkeley graduate students Danny Wilson and Julien Caubel researched what it would take to create their own.
Meanwhile, Kirchstetter had been in touch with Joshua Apte, assistant professor at the University of Texas at Austin, about his work leading Environmental Defense Fund’s mobile pollution monitoring study using Google Street View cars to measure air quality in Oakland. Apte asked Kirchstetter to support the team’s analysis as they examined how pollution concentrations varied from block to block—including black carbon. That’s when a lightbulb went off for Kirchstetter.
An audacious idea takes shape
Kirchstetter wondered, “should we be audacious enough to propose completing our sensors and distributing them throughout Oakland as well?” He went back to the lab and drafted a concept for a low-cost, robust sensor network to install across West Oakland that would complement EDF’s mobile efforts. The Berkeley team envisioned 100 sensors positioned across the area that would track black carbon over the course of 100 days. The sensors would send information back to a central database that would monitor changes in pollution levels and note the performance of the sensors on a map. They’d call it the 100×100 study.
My colleagues at EDF were intrigued. “While our mobile monitoring project was measuring how black carbon and other pollutants varied at small distance intervals, Tom’s idea was to measure how pollutants changed over time,” explained Millie Chu Baird, Associate Vice President of EDF’s Office of Chief Scientist. After meeting over coffee one Saturday in Oakland, “We immediately saw value in how the two projects could complement each other and tell us even more about local air pollution in Oakland, so we funded it.”
Pairing mobile monitoring with a stationary network like 100×100 can help researchers understand where pollutant levels are higher and lower as well as the main sources causing the pollution. For example, a mobile monitor can measure pollution throughout a neighborhood but isn’t everywhere all of the time, while a stationary sensor can measure pollution at selected locations twenty-four hours a day, seven days a week. Together, these complementary approaches paint a picture, showing how traffic patterns or even the shift times of truck drivers can impact the level of air pollution.
Community advocates provide critical support
Kirchstetter and team, led by Caubel, research associate Troy Cados, and graduate student Chelsea Preble, set out to validate the performance of their sensors and then manufacture at least 100 low-cost units small enough to install on light posts, fences, and exterior walls, yet robust enough to provide highly accurate measurements in an outdoor environment. And they had to be cheap enough to replace in the event of loss, damage, or theft.
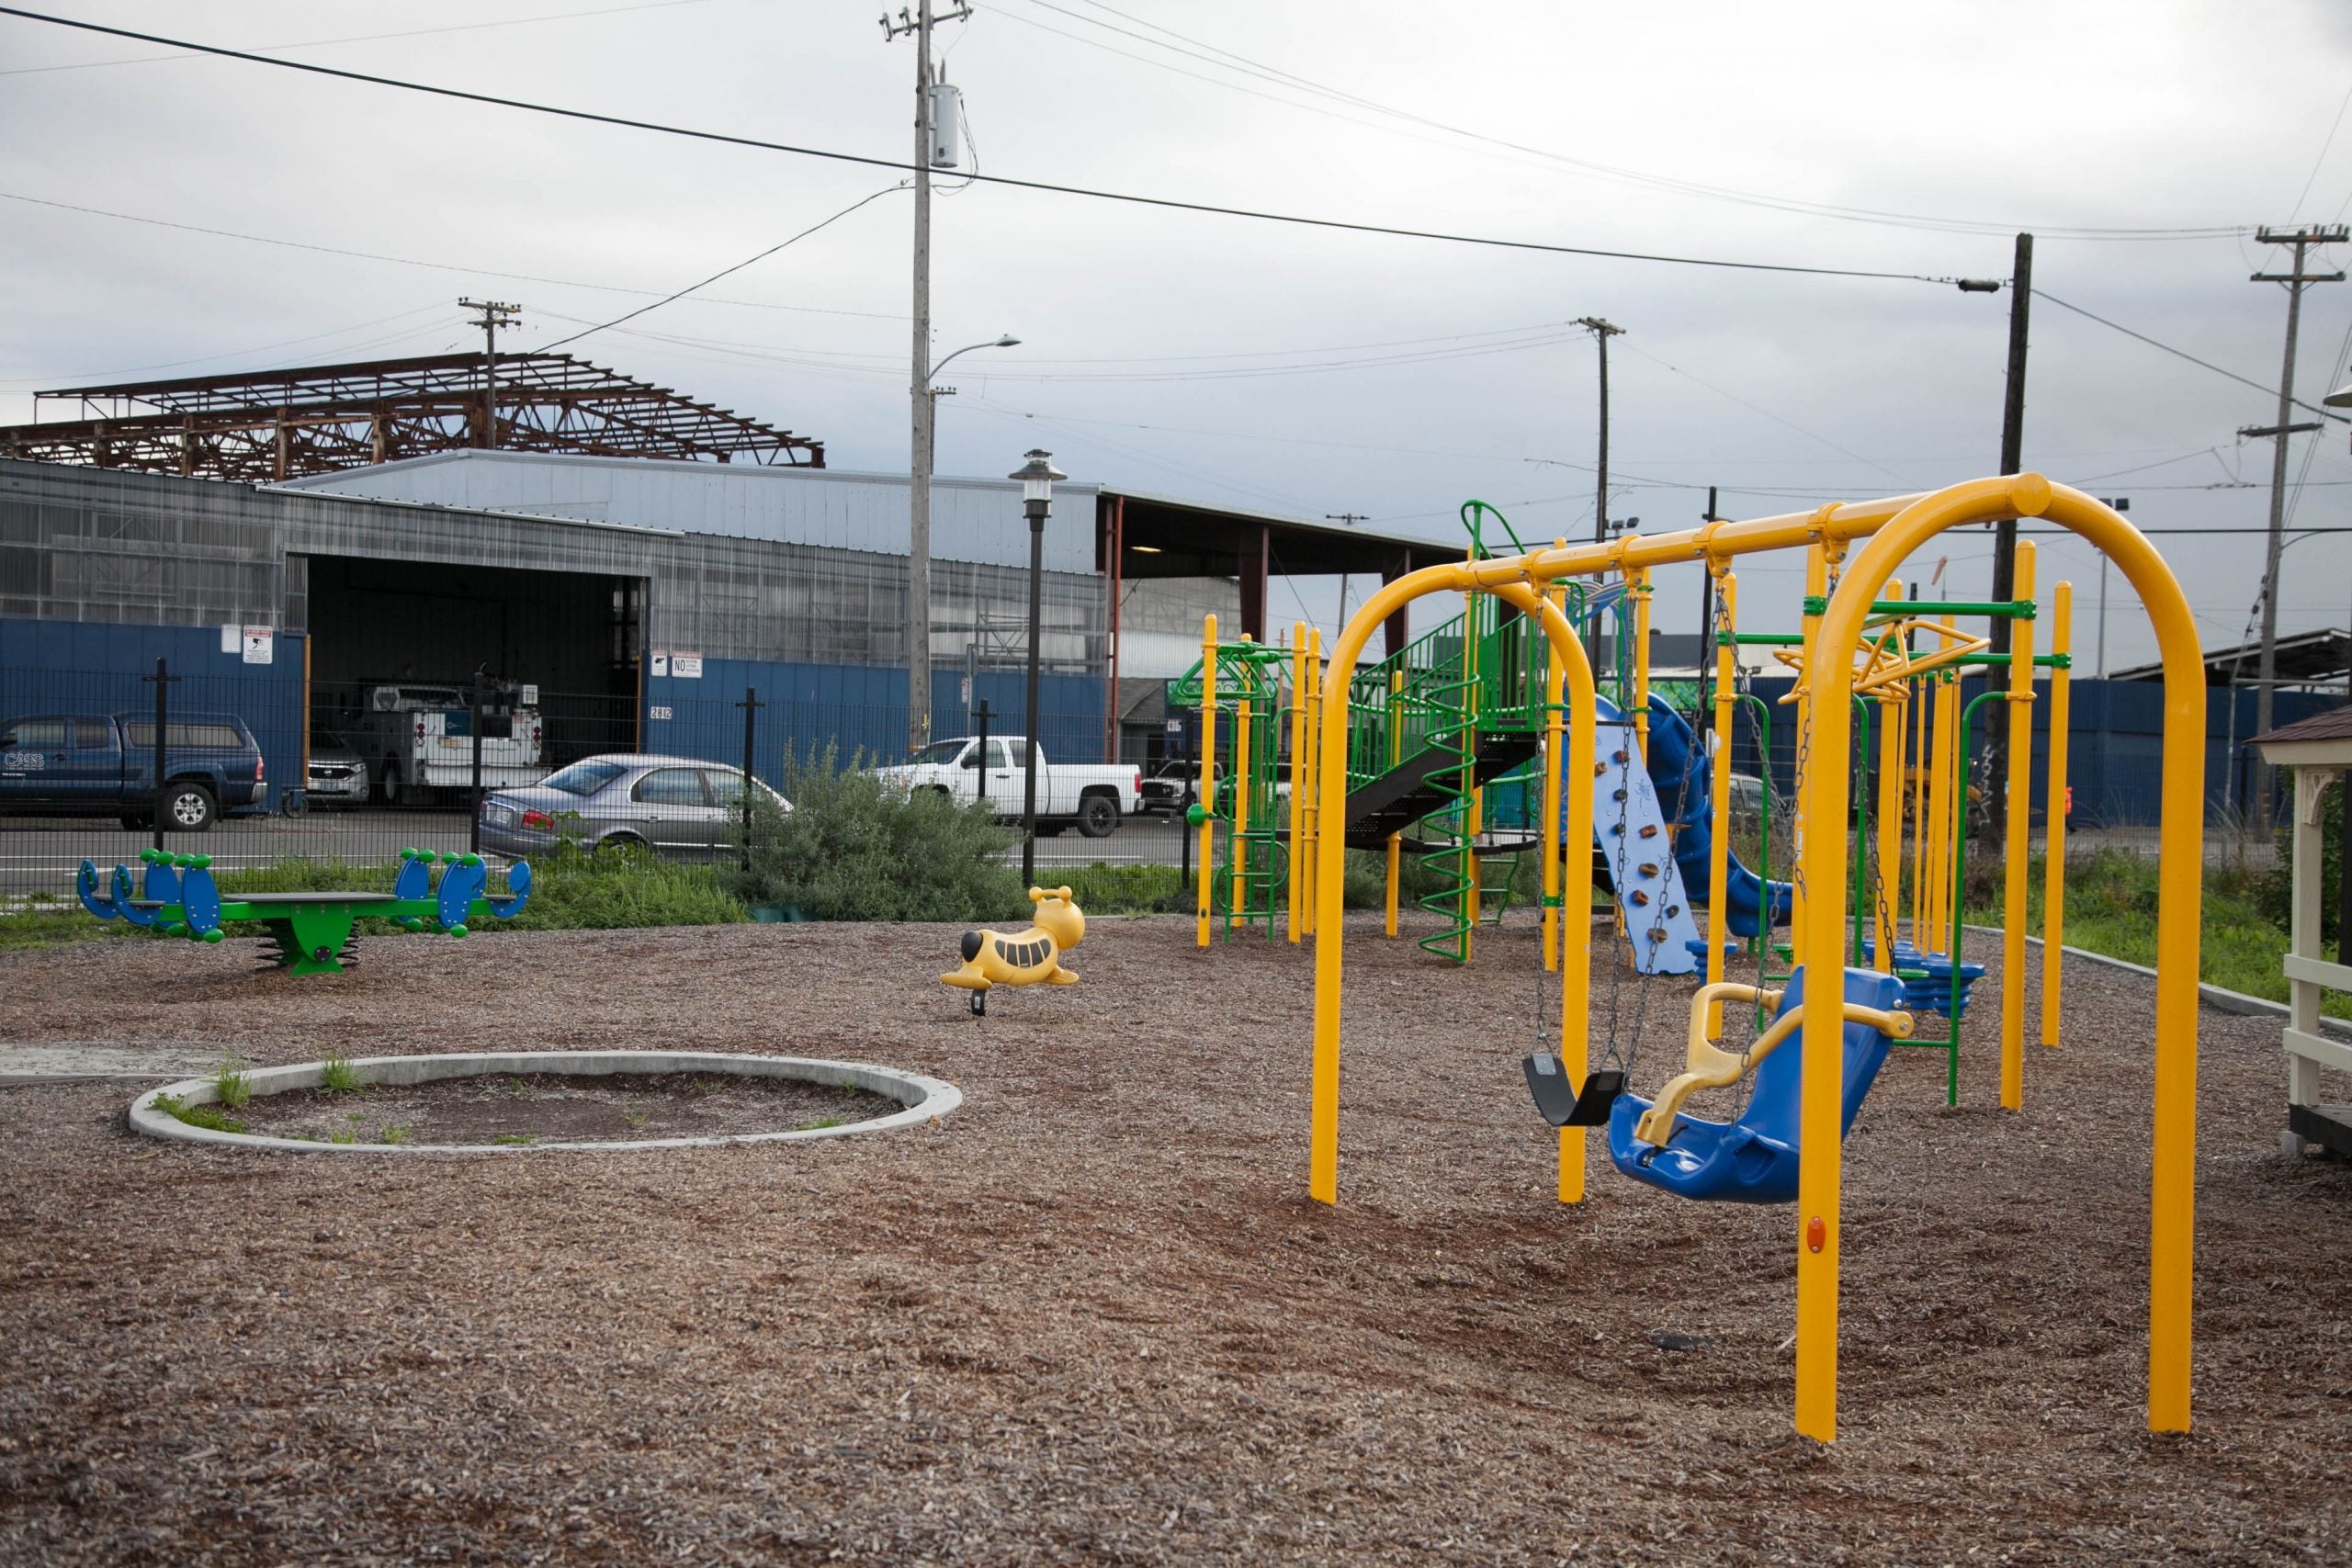
Once the sensors were ready, the team began to plan for where in West Oakland to install them. “We wanted to have good spatial coverage that represented all different types of locations in West Oakland,” Preble said. “We especially wanted to capture the Port of Oakland boundary, major truck routes, arterial roads, industrial areas, and residential neighborhoods.”
To ensure that the placement of monitors reflected the local knowledge and priorities of the West Oakland community, EDF and the Berkeley team partnered with the West Oakland Environmental Indicators Project (WOEIP), a local environmental justice organization with deep experience in citizen science and air pollution advocacy. WOEIP, which had also worked with us on our mobile mapping project, advised on monitor placement and led outreach to residents and local businesses who would host the monitors.
“This is not the first project that we have done to engage residents and place instruments or devices in their homes,” Ms. Margaret Gordon, Co-Director of WOEIP.
“WOEIP recruited 55 residential hosts, and Julien and I drove around for a few weeks, stopping at businesses to ask if we could install the sensors,” Preble recalled. Most of the people who hosted the monitors were interested in learning about the monitoring itself. “Especially those who lived near truck routes and industrial zones,” Preble noted.
Installing the sensors required the careful recruitment of potential hosts, but keeping them up and running mandated a dedicated team of undergraduate students who fanned out to the sites to change batteries and the filters that collected the black carbon nearly every day, logging more than 2,000 maintenance visits over the course of 100 days. To manage the process, the team used a website that Cados built to display the status of every sensor in real-time.
Research sparks new startup, aids community in clean air efforts
Now that the monitoring portion of the 100×100 study has wrapped up and the researchers are set to publish their results this summer, can they say it worked? Absolutely, the team asserts. Their research demonstrated that a network of low-cost sensors can provide powerful data that reveals where clean air efforts could be focused. Furthermore, the dataset is being used by other researchers to develop state-of-the-science models that can predict air pollution levels within communities. So, the research study in West Oakland may help them understand air pollution in other communities.
For their part, Caubel and Cados are working to reduce the resources required for such a project. Not only did the 100×100 study require near full-time labor from Preble, Caubel, Cados, and a team of eager undergraduates; it also produced 15 million data points that streamed in over the course of 100 days, which takes even more effort to qualify and analyze. Caubel and Cados have started a new company—Distributed Sensing Technologies—that’s taking the core technology the team developed and is streamlining the process, making it less expensive so others can conduct similar research elsewhere.
As the West Oakland community uses insights from EDF’s earlier mobile monitoring study to advocate for cleaner air under California’s landmark AB 617 law, the 100×100 results—due to be published early this summer—are already providing them with even more actionable data to support their efforts. Ms. Margaret, who has already met with the residents who hosted the monitors, notes that there’s still a great deal of work ahead for residents advocating for cleaner air. “It’s a good advocacy tool; it supports the community,” she said. “We know there are still high levels of pollution between the freeways and the port. It’s how we use it that’s the issue.”