Where are Illinois’ lead pipes? Chicago Water has nearly 60%, and small systems don’t know.

Tom Neltner, J.D., Chemicals Policy Director and Lindsay McCormick, Program Manager.
Chicago is the epicenter for lead service lines (LSLs) in the United States. In a report submitted to Illinois Environmental Protection Agency (IEPA) in April, Chicago Water reported having 392,614 LSLs – 75% of the total service lines in its water system that serves 2.7 million people living in the city and the city’s 125 suburbs. The number of LSLs is over three times higher than any other city. For additional context, this number represents 58% of the known LSLs in Illinois and 6% of the estimated 6.1 million LSLs in the country.
Chicago Water also reported an additional 120,760 service lines as unknown material that may be lead. Only 7,299 (2%) of its total service lines are made of something other than lead.
These numbers are based on the second year of mandatory reporting that IEPA makes publicly available. Earlier this year, we summarized the first year of reporting. In the second year of reporting, IEPA improved the program by allowing CWSs to separately report lines of unknown material where the utility was confident they were not LSLs – most likely because the lines were installed after the date the CWS stopped allowing use of lead. So the remaining lines of “unknown material” were more likely to be lead. In addition, all community water systems (CWSs) in the state reported in the second year.[1] Given these improvements, we looked more closely at the data.
Chicago Water’s numbers of reported lines of lead and unknown material reversed from last year. It appears that the utility reclassified about 2/3 of the service lines of unknown material to LSLs. From our perspective, this reclassification is a good sign because the utility is getting a better understanding of its situation. In another positive sign, the city’s new mayor is reportedly developing a plan to replace the LSLs.
Overview of the second year of reporting
This year’s data provides our first real insight into how large, medium, and small CWSs are doing to developing and refining their service line inventories in Illinois and may be indicative of other states. The table below provides the key numbers for each category.
Table 1. Reported service line material for different size CWSs in Illinois
| Category | # of CWSs* | Total lines | LSLs (% of total) | Lines of unknown material (% of total) | Ratio of unknown lines to LSLs |
|---|---|---|---|---|---|
| Chicago Water | 1 | 520,673 | 392,614 (75%) | 120,760 (23%) | 1 : 3.3 |
| Large CWSs (> 50K served)* | 30 | 912,152 | 130,223 (14%) | 333,851 (37%) | 2.6 : 1 |
| Medium CWSs (10 to 50K served) | 192 | 1,441,689 | 129,669 (9%) | 346,604 (24%) | 2.7 : 1 |
| Small CWSs (<10 K served) | 1,283 | 836,683 | 26,292 (3%) | 250,075 (30%) | 10 : 1 |
| Total | 1,506 | 3,711,197 | 678,798 (18%) | 1,051,290 (28%) | 1.6 : 1 |
| * Excluding Chicago Water and CWSs that began operation after 1986 when the new LSLs were banned nationally. | |||||
On the surface, small CWSs have far fewer LSLs compared to the larger systems – only 3% compared to 9% for medium and 14% for large CWSs. However, the LSL estimate for all system sizes could be hundreds of thousands if more lines of unknown material are ultimately reclassified as LSLs (as happened for Chicago Water).
One important measure of a successful program is the ratio of lines of unknown material to LSLs. A lower ratio indicates that the CWS has a better understanding of the actual number of LSLs it has and, therefore, can more effectively set priorities, secure the needed resources, and sequence replacement efforts. By this measure, small CWSs have the weakest understanding of their situation with 10 lines of unknown material to every known LSL – almost four times larger than medium and large CWSs.
Does the size and location of small systems impact reporting?
While small CWSs are considered rural, many are found in small towns and suburbs. To help understand if the size of the community in which a small CWS operates is important, we assigned Illinois’ small CWSs to four types of communities based on the U.S. Census Bureau designations:[2]
- Rural Area: An area not designated below. Illinois has 25 rural counties with a total of 273 small CWSs.
- Micropolitan Area: A community that has an urban area with a population of at least 10,000 but fewer than 50,000 people. Illinois has 18 micropolitan areas not included in one of the six CSAs (see below) or six metropolitan areas with a total of 270 small CWSs.
- Metropolitan Area: A community that has an urban area of at least 50,000 people. Illinois has six metropolitan areas not included in one of the six CSAs with a total of 210 small CWSs.
- Combined Metropolitan Area (CSA): A combination of adjacent metropolitan and micropolitan areas that have demonstrated economic or social linkage. Illinois has six of these CSAs including Chicago and St. Louis with a total of 530 small CWSs.
The figure and table below summarizes the latest data. The percent of service lines with unknown material that may be lead ranges from 37% in rural areas and progressively decreases to 26% in combined metro areas. About 5% of the service lines in combined metro areas are known LSLs compared to less than 2% in the other areas.
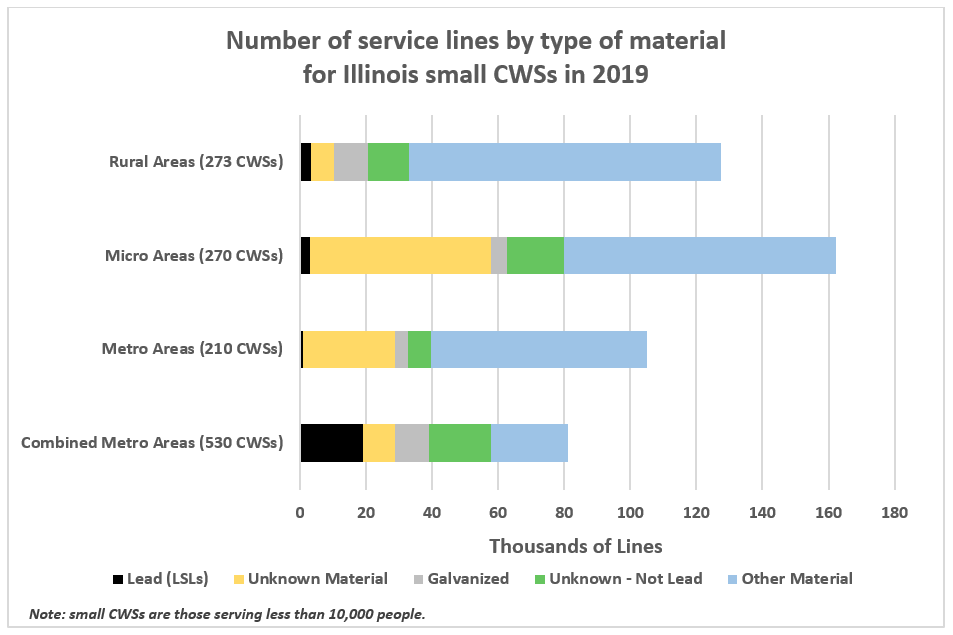
Table 2. Service line material reported by small CWSs in Illinois and comparison of unknown lines to LSLs
| Illinois Small CWS Reporting in 2019 | Total Service Lines | Lead (LSLs) (% of total) | Unknown Material (% of total) | Ratio of unknown lines to LSLs | Galvanized (% of total) | Unknown - Not Lead (% of total) | Other Material (% of total) |
|---|---|---|---|---|---|---|---|
| Rural Areas (273 CWSs) | 190,745 | 3,393 (2%) | 70,490 (37%) | 21 : 1 | 10,254 (5%) | 12,214 (6%) | 94,394 (49%) |
| Micro Areas (270 CWSs) | 162,384 | 2,908 (2%) | 55,008 (34%) | 19 : 1 | 4,635 (3%) | 17,389 (11%) | 82,444 (51%) |
| Metro Areas (210 CWSs) | 105,036 | 926 (1%) | 27,907 (27%) | 30 : 1 | 3,801 (4%) | 6,946 (7%) | 65,456 (62%) |
| Combined Metro Areas (530 CWSs) | 378,518 | 19,065 (5%) | 96,670 (26%) | 5 : 1 | 10,361 (3%) | 18,672 (5%) | 233,750 (62%) |
| Total for all Small CWSs (1283 CWSs) | 836,683 | 26,292 (3%) | 250,075 (30%) | 9.5 : 1 | 29,051 (3%) | 55,221 (7%) | 476,044 (57%) |
As displayed in the table above, the small CWSs in combined metro areas have a much better “score” (ratio of unknown lines to LSLs -see last column): 5 compared to 19, 21, and 30 in the other areas. When we compared the six combined metro areas, Chicago Metro Area stood out with a score of 3 compared to scores over 18 in the other areas. It appears that the attention on the city’s LSLs may have prompted the small CWSs in the Chicago Metro Area to take a closer look than their counterparts across the state.
Summary
Illinois has the most comprehensive inventory of service line materials in the country, which should serve as a model for other states. Based on the second year of reporting, Chicago Water is facing a serious challenge with 392,000 known LSLs and up to 512,000 service lines that may be lead. However, the good news is that Chicago Water is beginning to get a handle on the situation, with most service lines classified as “unknown” in 2017 now being classified as LSLs. In contrast, small CWS in the state have far less understanding of the situation with just 26,000 known LSLs and 276,000 service lines that may be lead – a greater than ten-fold range. Through this annual reporting, these small CWSs will likely refine their estimates, and we encourage them to join the almost 180 communities we know of across the country that are taking steps to replace their LSLs.
[1] In 2017, 84 small CWSs did not submit a report.
[2] For Illinois, we used the designations in Wikipedia.