


Tom Neltner, J.D., is Chemicals Policy Director and Dr. Ananya Roy is Health Scientist
Last week, we noted in our blog that the Environmental Protection Agency (EPA) dropped the statement that paint, dust and soil are the most common sources of lead in its “Protect Your Family from Lead in Your Home” booklet. Property owners provide this booklet to prospective homebuyers and tenants in housing built before 1978. The change implicitly recognizes that there is no safe level of lead in the children’s blood, and we must reduce all sources of lead exposure. It also acknowledges that the relative contribution of air, water, food, soil, dust, and paint to children’s blood lead levels is complicated. Exposure varies significantly based on age of the home, the child’s race and age, the family’s income-level, and region of the country. Any simplification obscures these important differences.
EPA’s scientists made this clear in a model published earlier this year that pulled together the available data, divided children into three age categories, and assigned children in each category into ten groups based on their overall lead exposure. For each group, they estimated the relative contribution of air, water, food, and soil/dust (from paint). Not surprisingly, children living in older homes with lead-based paint hazards by far have the most exposure to lead. For 1 to 6 year olds in the top 90-100 percentile, more than 70% of the lead in their blood is from soil and dust. The contribution from food is 20% and drinking water is 10%. For infants, soil and dust contributes to 50% of the lead in blood, while 40% is from water and 10% from food.
Since there is no known safe level of lead in blood, we must do even more to reduce children’s exposure to lead-contaminated soil and dust.
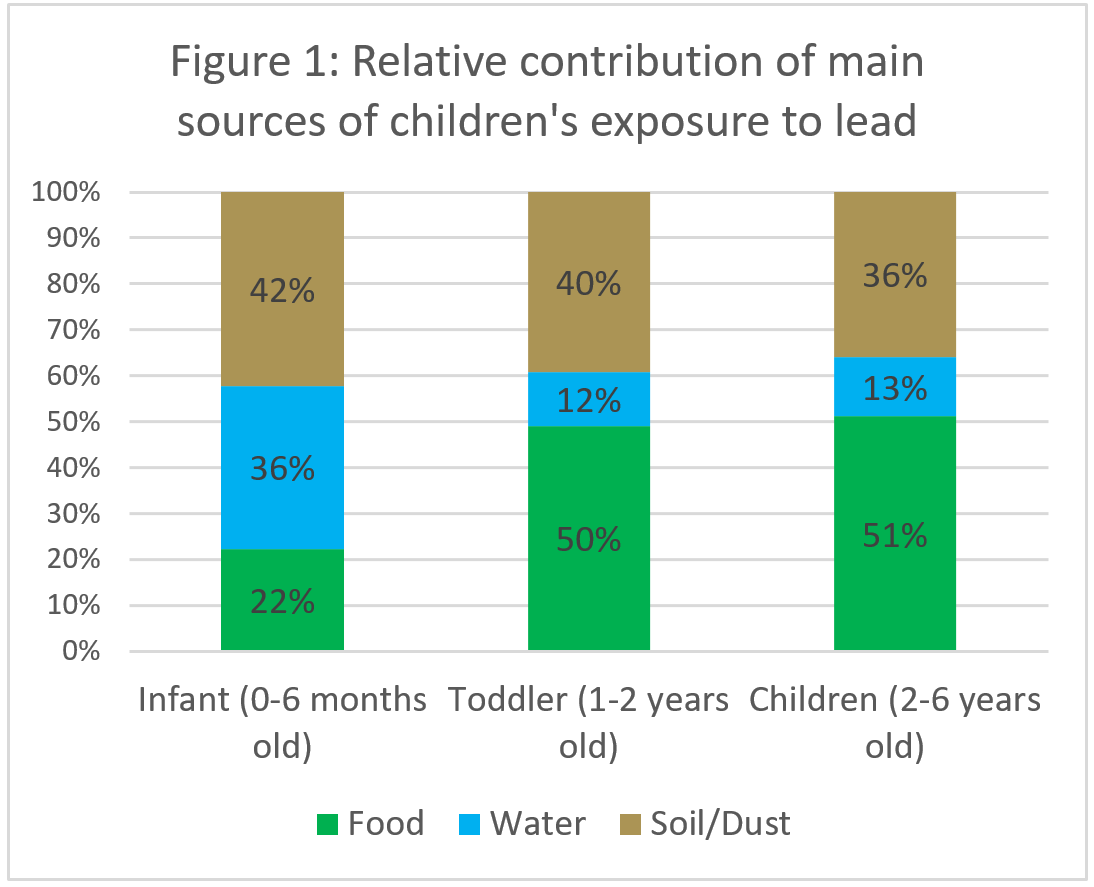 However, to prioritize action at a national level, it is important to understand how different sources contribute to lead exposure in the average child as well as the most-exposed child. We used the underlying EPA data to calculate the average relative source contribution of different sources to blood lead levels for infants from birth to six months old, for toddlers 1 to 2 years old, and young children from 1 to 6 years old. The results indicate that infants have a much higher source contribution of lead from water in comparison to older children (Figure 1). For the average child 1 to 6 years old, food is the largest source of lead exposure, with 50%, followed by soil/dust then water.
Like all models, EPA’s estimates have limitations that must be considered. We encourage you to read the report to get the details. Here are the key points:
- The analysis applies to the U.S. residential population and was not designed for specific at-risk populations or households. Contributions from pathways are highly dependent on scenarios being considered. For example, while the air pathway contributed the least for this national analysis, this assessment was not intended to characterize air-related impacts for those living near sources of lead emissions in air (e.g., near battery recycling facilities, near airports). When considering public health protection from lead, looking across all media and source-specific exposures includes a comprehensive investigation in which local-scale source impacts are characterized; these local impacts may provide avenues for meaningful reductions in lead exposure.
- More up-to-date data and information on key model inputs (e.g., children’s soil/dust ingestion rate and bioavailability and concentration in water levels actually consumed by children) would help refine model estimates for quantifying and reducing uncertainties and to focus on specific at-risk populations and communities.
On this second point, progress is underway, the Department of Housing and Urban Development (HUD), with the support of EPA, is updating its American Healthy Housing Survey from 2005 that serves as the basis for most of the paint, soil and dust exposure estimates. In this round, HUD will also be collecting drinking water samples using two different methods: 1) the first draw sample from the kitchen tap after letting the water sit in the pipes overnight used by EPA to evaluate compliance with its Lead and Copper Rule; and 2) a 100 mL sample taken by the homeowner whenever water is used from the kitchen tap for drinking or cooking. HUD has been waiting on final approval by the Office of Management and Budget since June 2017. Assuming OMB decides quickly, HUD may be able to have the data by early 2019.
In addition, the Food and Drug Administration upgraded its method to analyze food samples so lead can be detected and quantified at lower levels.
With better data on children’s exposure to lead in food, water, and soil and dust, we will gain a better understanding of the relative contribution of the sources and where we need to focus our resources. However, we must remain vigilant in our broader efforts to reduce all sources of children’s exposure to lead.
One Comment
I agree with the overall assessment here (and in the referenced article) but another way to look at this is that as our concern with lower level exposures increases, the contributions from lesser sources of environmental lead exposure become more significant. This is why the contribution from drinking water was less of a concern when the EPA last updated its standard more than 20 years ago when the CDC action level was at 10 ug/dl (and average BLLs in the US were much greater). To maintain children’s blood lead levels at lower levels it will become increasing important to pay more attention and assess more sources of exposure including those that we once thought of as trivial. This is also why regulatory standards for soil, paint, dust, food, and water should be updated. This should be one of the lessons from Flint.