


By John Rutecki & Sean Hackett
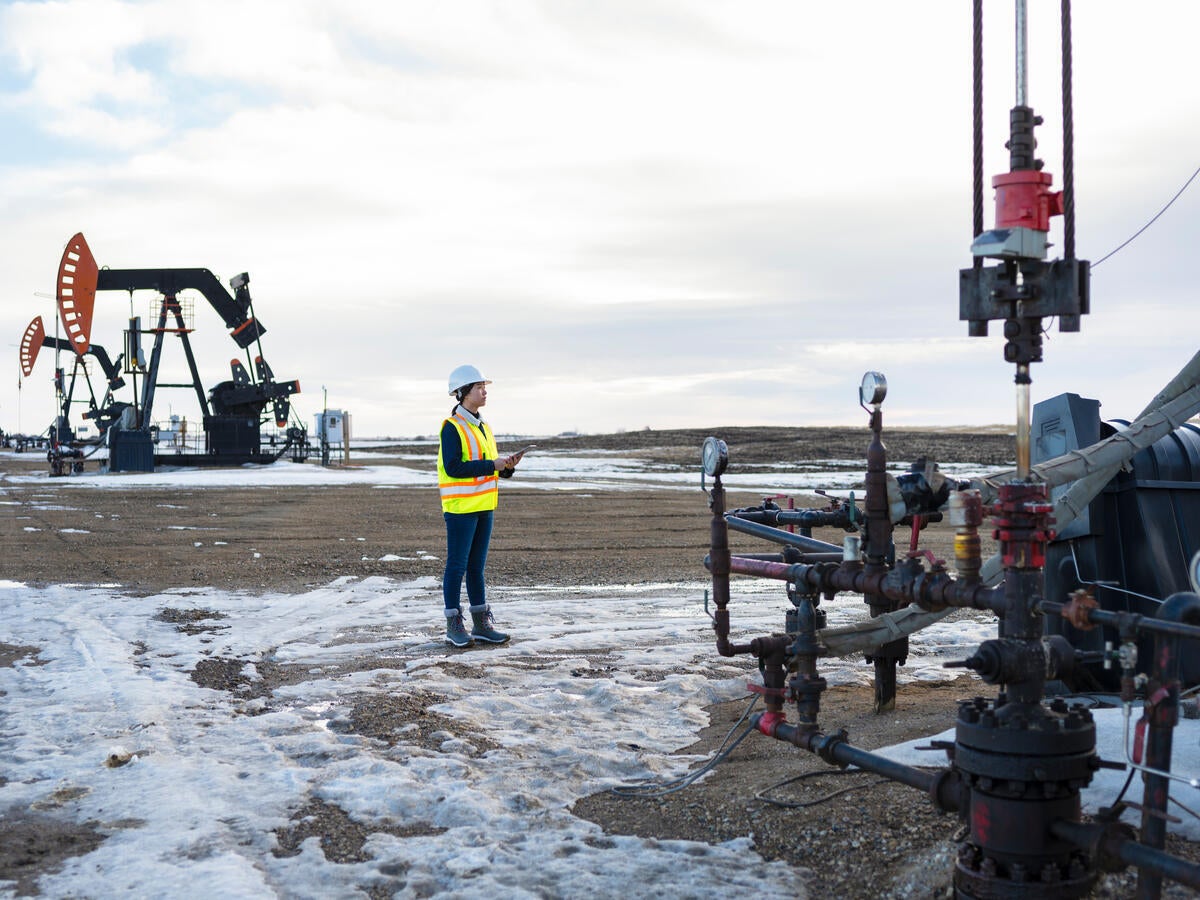
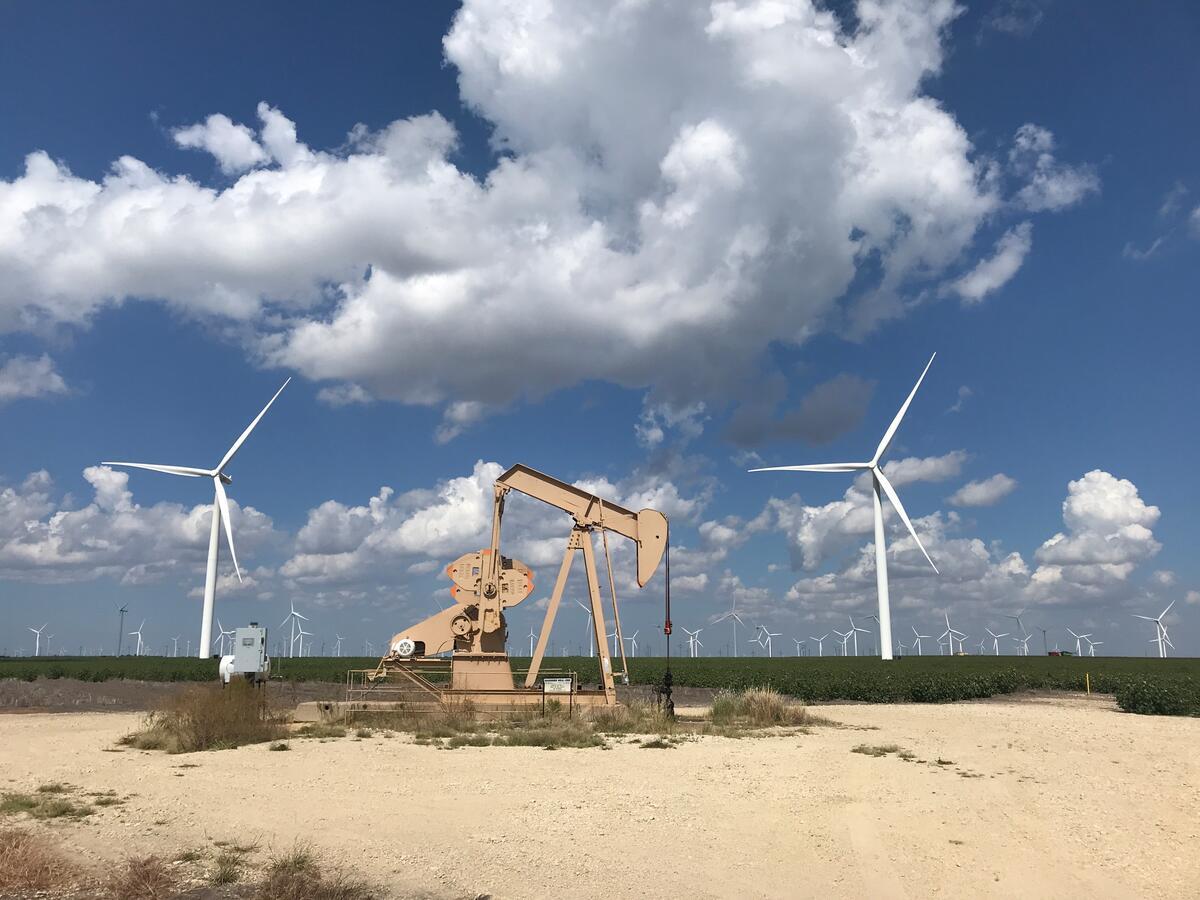
- Wyoming has historically embraced responsible stewardship of the land and resources, and should now apply that principle to methane emissions from oil and gas.
- This will keep their energy exports competitive globally, encourage job growth in the methane mitigation industry and lead to cleaner air. Several operators in the state are already showing that lower-emissions production is possible and affordable.