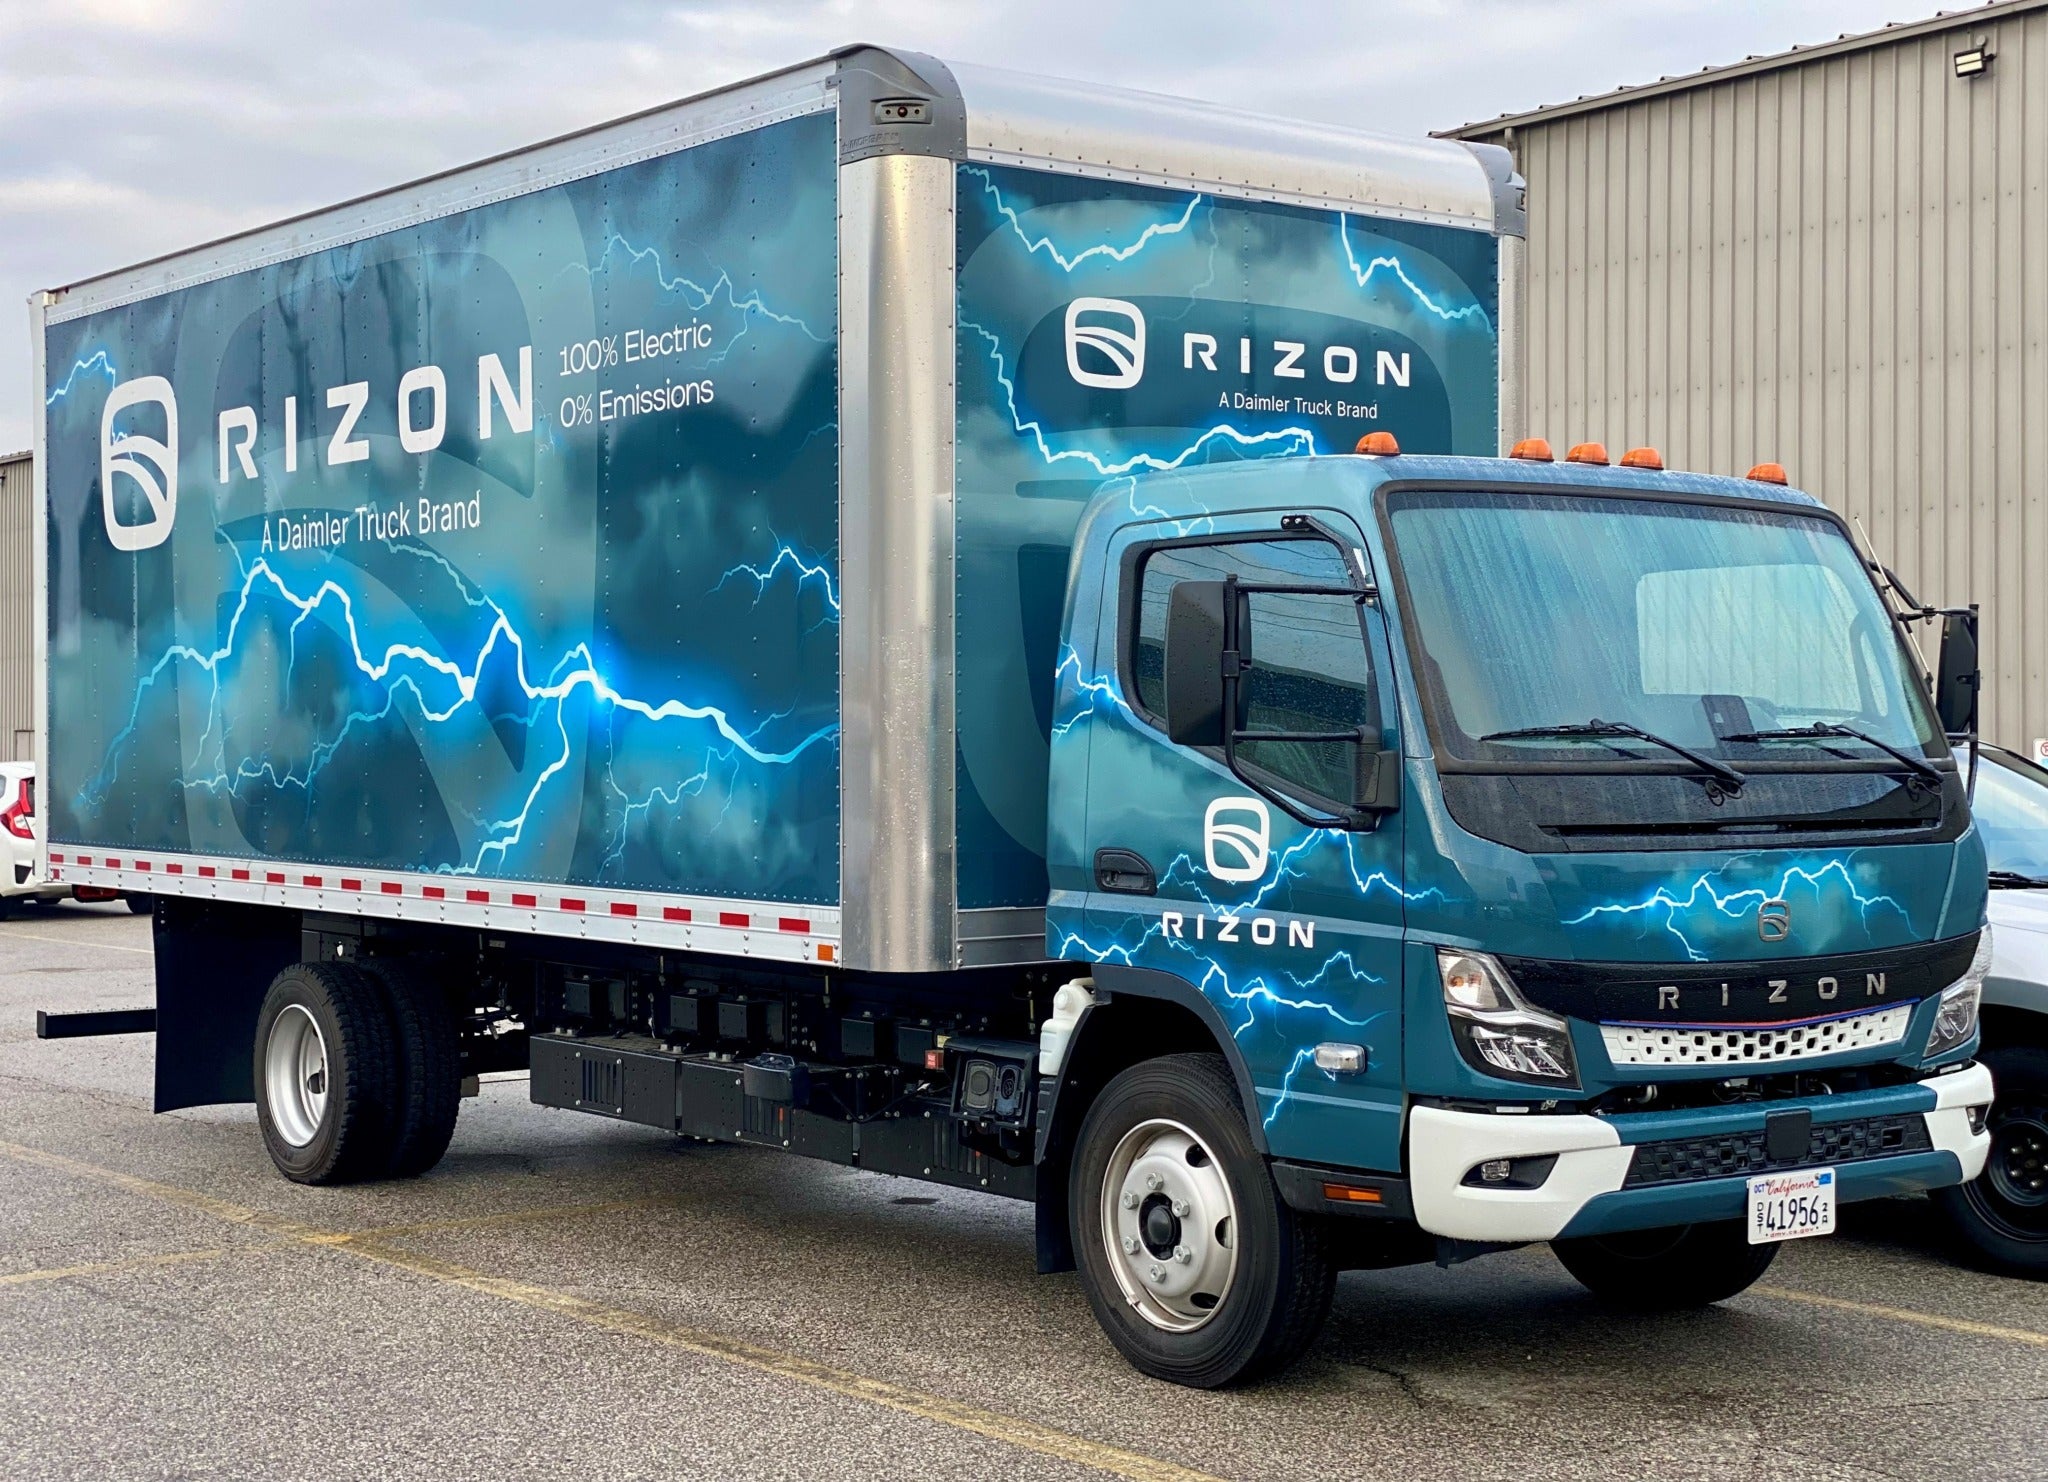
The Environmental Protection Agency (EPA) released a new online tool today which provides data about pollution emissions for the country’s largest industrial emitters of greenhouse gases (GHG). Together, these industry sources are responsible for billions of tons of climate disrupting pollution. This will be the first time that this data is publicly available and will inform Americans about the heat-trapping greenhouse gases emitted in their communities.
EDF attorney Peter Zalzal sums up our enthusiasm for this new tool. “Americans have a right to know about the pollution in their air. This greenhouse gas emissions data promotes transparency and provides a strong foundation for Americans to work together in deploying smart climate policies.”
Who and What is Included
The consumer friendly web platform will provide climate pollution data for 8,000 industrial facilities including cement, iron and steel producers, petroleum refiners, and pulp and paper manufacturing. The data is based on 2010 annual pollution discharges. The tool includes major industrial sources that emit 25,000 tons of carbon dioxide equivalent or more per year. This 25,000 ton annual carbon dioxide threshold is comparable to the emissions from 131 rail cars of coal consumed or 58,000 barrels of oil consumed.
The data for direct GHG emitters show that in 2010:
- Power plants were the largest stationary source of direct U.S. GHG emissions with 2,324 million metric tons of CO2, followed by refineries with 183 million metric tons of CO2e.
- CO2 emissions accounted for largest share of direct emissions with 95 percent, followed by methane with 4 percent, and nitrous oxide and fluorinated gases representing the remaining 1 percent.
- 100 facilities each reported emissions over 7 million metric tons of CO2, including 96 power plants, 2 iron and steel mills and 2 refineries.
Facility | City | State | Total Reported Emissions (MMT CO2) | Sectors |
ExxonMobil BT Site | Baytown | TX | 11 | Refineries |
Limestone | Jewett | TX | 13 | Power Plants |
Martin Lake | Tatum | TX | 19 | Power Plants |
Monticello | Mount Pleasant | TX | 14 | Power Plants |
Sam Seymour | La Grange | TX | 11 | Power Plants |
W A Parish | Thompsons | TX | 17 | Power Plants |
Welsh Power Plant | Pittsburg | TX | 11 | Power Plants |
How This Data can be Used
You can search and sort information by geographic area and type of industry, and compare emissions among facilities. Additionally, you can also share this information on social media channels, such as Facebook or Twitter.
This new pollution information is important because provides policymakers with crucial data to design solutions to reduce global warming. It also strengthens corporate governance and sustainability through providing rigorous data that tracks pollution data for comparison between facilities. Lastly, it provides investors with transparent information and will identify companies that are leading the way in reducing climate pollution and those who are lagging behind.
Check out the new EPA web platform today and find out about pollution in your community.