Market Forces

How reverse auctions can help scale energy storage

This post is co-authored with Maureen Lackner

Just as reverse auctions have helped increase new renewable energy capacity, our new policy brief for the Review of Environmental Economics and Policy argues they could also be an effective approach for scaling energy storage.

Why we need energy storage

Voters have spoken, and states are moving toward cleaner electricity. Legislatures in Hawaii and California passed mandates for 100 percent clean energy in the electricity sector, and governors in Colorado, Illinois, Nevada, New Jersey, New York, Maine, and Michigan have all made similar 100 percent clean energy promises in recent months. These ambitious targets will require large-scale integration of wind and solar energy, which can be unpredictable and intermittently available. Cost-effective energy storage solutions can play a leading role to provide clean, reliable electricity—even when the sun isn’t shining and wind isn’t blowing.

Energy storage systems—ranging from lithium-ion (Li-ion) batteries to hydroelectric dams—can provide a wide array of valuable grid services. Their ability to bank excess energy for use at a later date makes them particularly well-suited to address the intermittency challenge of wind and solar. In some cases, energy storage systems are also already cost-competitive with natural gas plants.

However, in order to reach ambitious clean energy targets, we’ll likely need to close a large energy storage gap. One recent estimate suggests approximately 10,000 Gigawatt hours (GWh) of energy storage may be needed to support a two-thirds renewables domestic electricity mix. In our policy brief, we estimate the United States currently has no more than 10 percent of this utility-scale energy storage capacity available; the actual quantity is likely much lower. Developing vast levels of energy storage will likely be an important factor toward integrating a greater share of renewables into the energy mix. Smart policy design can help drive energy storage prices even further below current historic lows, while ensuring these technologies are procured cost-effectively.

A path forward: using reverse auctions to scale energy storage

Reverse auctions have already helped scale renewables and, when designed well, may also be an effective tool when applied to energy storage. In a reverse auction, multiple sellers submit bids to a single buyer for the right to provide a good or service. In the case of renewables, developers bid to provide a portion of capacity desired by the buyer, typically a utility. This policy tool is gaining in popularity, because, if designed well, it can drive down bid prices and ensure reliable procurement. Globally, the share of renewables capacity procured through reverse auctions is expected to grow from 20 percent in 2016 to more than 50 percent in 2022. It seems likely that auction-induced competition has triggered a fall in renewable prices that some are calling the “Auctions Revolution.”

While examples in Colorado and Hawaii suggest reverse auctions can be effective in procuring energy storage, there’s little guidance on tailoring them for that purpose. We offer five recommendations:

1: Encourage a Large Number of Auction Participants

The more developers bidding into an auction, the fiercer the competition. How policymakers approach this depends on their end goal. In a 2016 Chilean auction, bidding was open to solar and coal developers, and policymakers were pleased when solar developers offered cheaper bids on a dollar per megawatt-hour basis than coal developers. Another approach: signaling consistent demand through auction schedules. Participation in South African renewable auctions increased after auction organizers took steps to give advance notice and instructions for future regular auctions.

2: Limit the Amount of Auctioned Capacity

If competition still seems tepid, auctioneers can always scale down the amount of capacity auctioned. As witnessed in a South African renewable auction, bidders respond to a supply squeeze by decreasing their bid prices.

3: Leverage Policy Frameworks and Market Structures

Auctions don’t exist in a vacuum. Renewable auctions benefit tremendously from existing market structures and companion policies. Where applicable, auction design should consider the multiple grid services energy storage systems can offer. Even if an auction is only focused on energy arbitrage, it should not preclude storage developers from participating in multiple markets (e.g. frequency regulation), as this may help bidders reduce their bid prices.

4: Earmark a Portion of Auctioned Capacity for Less-mature Technologies

A major criticism of early auctions is that they unintentionally favored the same large players and mature technologies. Policymakers shouldn’t forget that energy storage includes several technological options; they can design auctions to address this by separating procurement for more advanced technologies (Li-ion, for example) from newer technologies (zinc air batteries).

5: Penalize delivery failures without damaging competition

Developers should be incentivized to bid their cheapest possible price, but poor auction design can trigger a race to the bottom with ever more unrealistic bid prices. This is especially true if developers don’t believe they will be punished for delivery failures or poor quality projects. Already, some contract terms for energy storage by auctions include penalties if the developer cannot deliver its promised grid service.

Decarbonizing our energy supply isn’t an easy task. Reverse auctions stand out as a possible tool to quickly and cost-effectively increase our energy storage capacity, which will help integrate intermittent renewables. If this market-based mechanism can be tailored to suit energy storage systems’ capabilities (e.g. offering multiple grid services), it could help shift us to a future where we have access to clean energy at any time of day and year.

Also posted in Energy efficiency, Markets 101 / Leave a comment

What California’s history of groundwater depletion can teach us about successful collective action

California’s landscape will transform in a changing climate. While extended drought and recent wildfires seasons have sparked conversations about acute impacts today, the promise of changes to come is no less worrying. Among the challenges for water management:

These changes will make water resources less reliable when they are needed most, rendering water storage an even more important feature of the state’s water system.

One promising option for new storage makes use of groundwater aquifers, which enable water users to smooth water consumption across time – saving in wet times and extracting during drought. However, when extraction exceeds recharge over the long term, “overdraft” occurs. Falling water tables increase pumping costs, reduce stored water available for future use, and entail a host of other collateral impacts. Historically, California’s basins have experienced substantial overdraft.

Falling water tables reflect inadequate institutional rules

One cause of the drawdown is California’s history of open-access management. Any landowner overlying an aquifer can pump water, encouraging a race to extract. Enclosing the groundwater commons and thereby constraining the total amount of pumping from each aquifer is critical for achieving efficient use and providing the volume and reliability of water storage that California will need in the future. However, despite evidence of substantial long-run economic gain from addressing the problem, only a few groups of users in California have successfully adopted pumping regulations that enclose the groundwater commons.

SMGA addresses overdraft—but pumpers must agree to terms

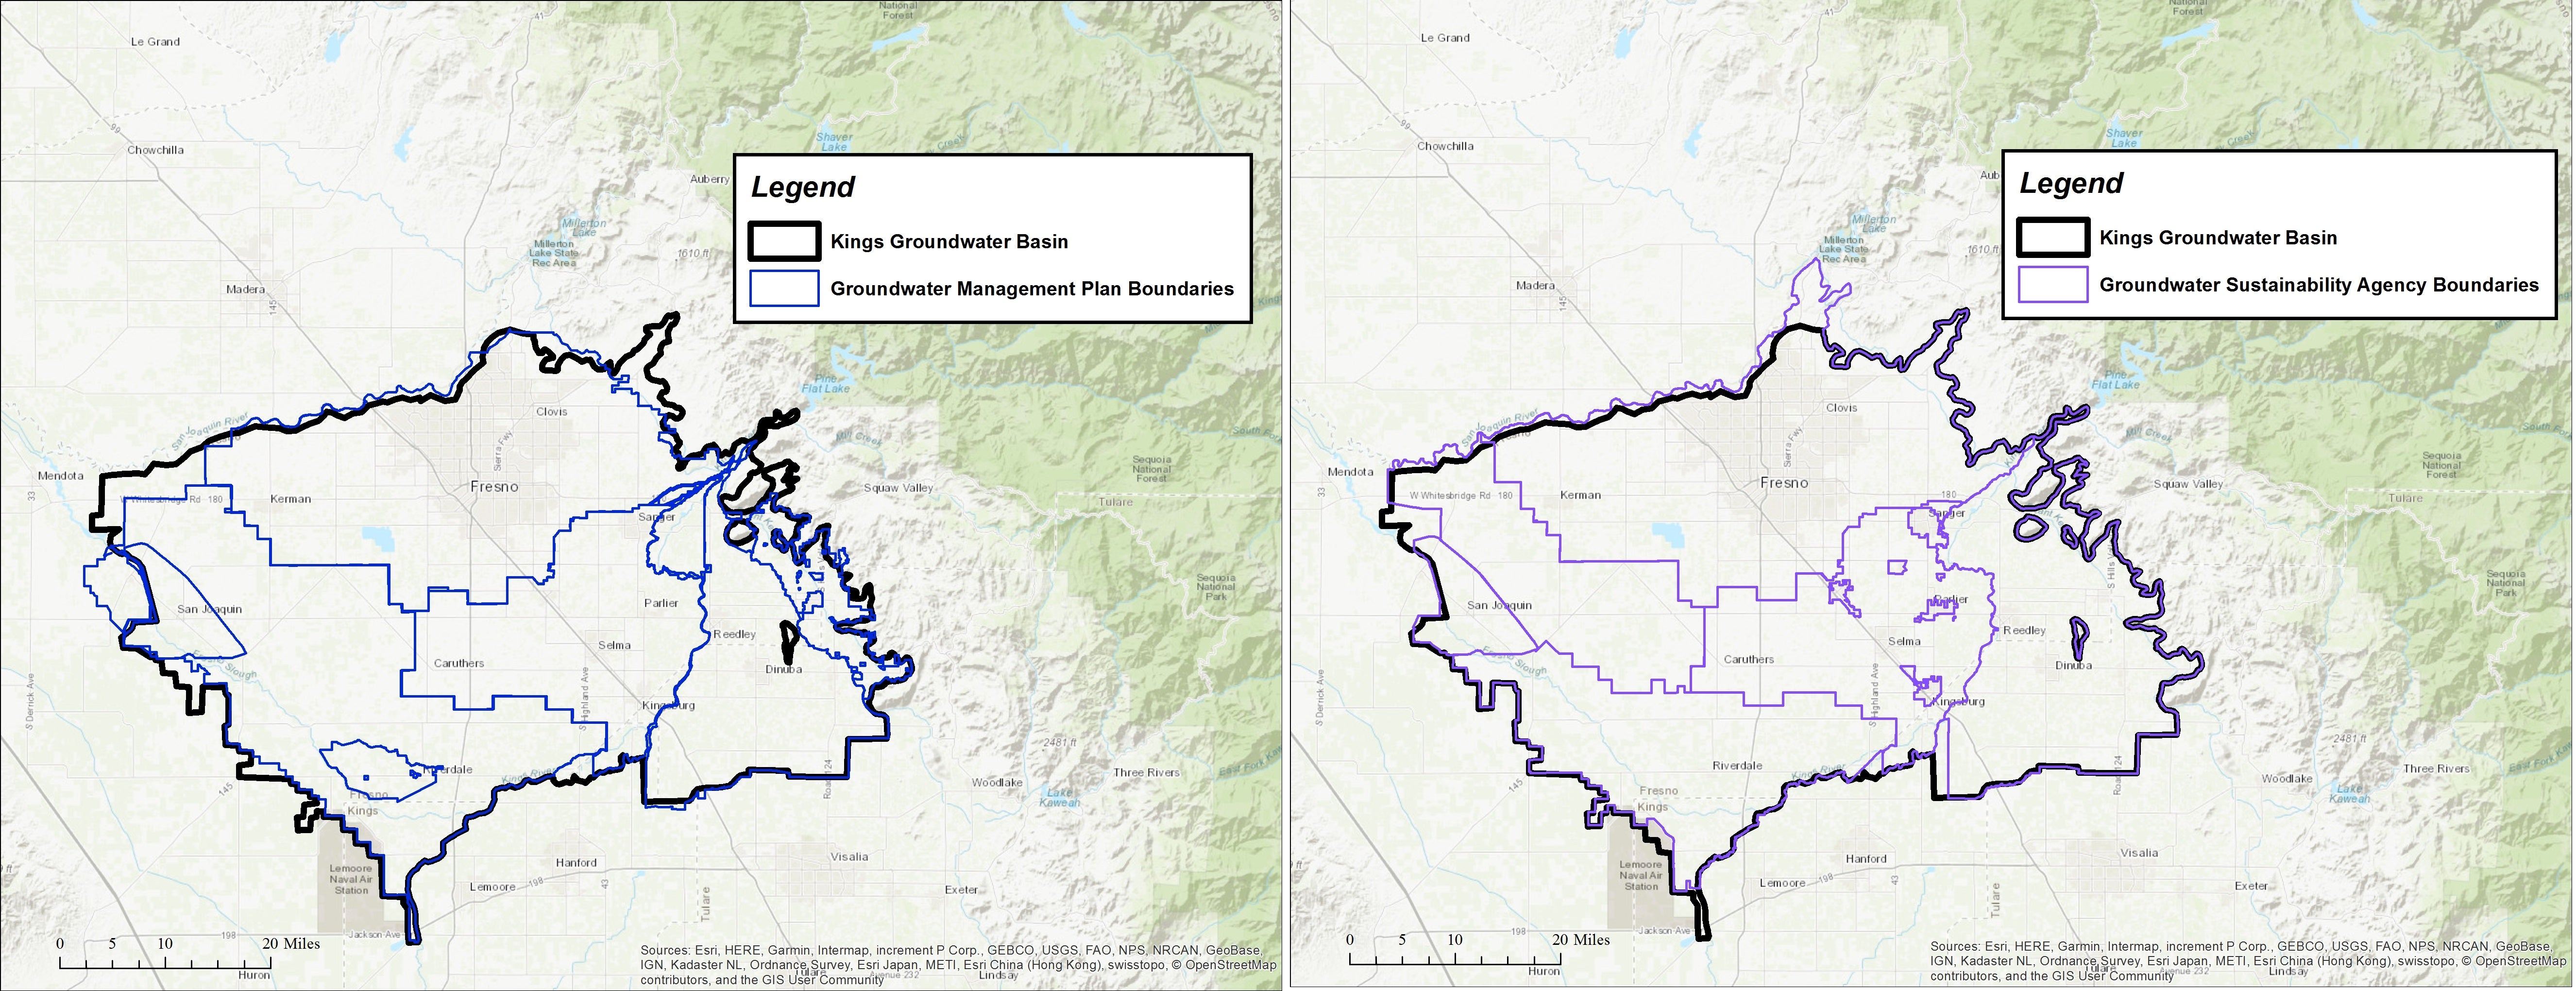
California’s Sustainable Groundwater Management Act (SGMA) of 2014 aims to solve this challenge by requiring stakeholders in overdrafted basins to form Groundwater Sustainability Agencies (GSAs) and create plans for sustainable management. However, past negotiations have been contentious, and old disagreements over how best to allocate the right to pump linger. The map presented below illustrates how fragmentation in (historical) Groundwater Management Plans also tracks with current fragmentation in Groundwater Sustainability Agencies (GSAs) under SGMA. Such persistent fragmentation suggests fundamental bargaining difficulties remain.

Spatial boundaries of self-selected management units within basins under SGMA (GSAs) mirror those of previous management plans (GMPs). Persistent fragmentation may signal that adoption of SGMA doesn’t mean the fundamental bargaining difficulties facing the basin users have disappeared.

New research, co-authored with Eric Edwards (NC State) and Gary Libecap (UC, Santa Barbara) and published in the Journal of Environmental Economics and Management, provides broad insights into where breakdowns occur and which factors determine whether collective action to constrain pumping is successful. From it, we’ve gleaned four suggestions for easing SGMA implementation.

Understanding the costs of contracting to restrict access

To understand why resource users often fail in adopting new management institutional rules, it’s important to consider the individual economic incentives of various pumpers. Even when they broadly agree that groundwater extraction is too high, collective action often stalls when users disagree about how to limit it. When some pumpers stand to lose economically from restricting water use, they will fight change, creating obstacles to addressing over-extraction. When arranging side payments or other institutional concessions is difficult, these obstacles increase the economic costs of negotiating agreement, termed “contracting costs.”

To better understand the sources of these costs in the context of groundwater, we compare basins that have adopted effective institutions in the past with otherwise similar basins where institutions are fragmented or missing. Even when controlling for the level of benefits, we found that failures of collective action are linked to the size of the basin and its user group, as well as variability in water use type and the spatial distribution of recharge. When pumpers vary in their water valuation and placement over the aquifer, the high costs of negotiating agreement inhibit successful adoption of management institutions, and overdraft persists. Indeed, in many of California’s successfully managed basins, consensus did not emerge until much farmland was urbanized, resulting in a homogenization of user demand on the resource.

Four key takeaways to ease agreement

In the face of such difficult public choices, how can pumpers and regulators come to agreement? Four main recommendations result from our research:

  • Define and allocate rights in a way that compensates users who face large losses from cutbacks in pumping. Tradable pumping rights can help overcome opposition. Pumpers can sell unused rights and are oftentimes made better off. The option to sell also incentivizes efficient water use.
  • Facilitate communication to reduce costs of monitoring and negotiations. The Department of Water Resources has already initiated a program to provide professional facilitation services to GSAs.
  • Promote and accept tailored management. Stakeholders and regulators should remain open to approaches that reduce contracting costs by addressing issues without defining allocations or attempting to adopt the most restrictive rules uniformly throughout the basin. For example, pumpers have successfully adopted spatially restricted management rules to address overdraft that leads to localized problems; others have adopted well-spacing restrictions that reduce well interference without limiting withdrawals.
  • Encourage exchange of other water sources. Imported, non-native surface water may lower contracting costs because it can save users from large, costly cutbacks. Pumpers have written contracts to share imported water in order to avoid bargaining over a smaller total pie; where such water is available, exchange pools (such as those described here) can help to limit the costs of adjustment.

SMGA is a large-scale public experiment in collective action. To avoid the failures of previous attempts to manage groundwater, stakeholders crafting strategies for compliance and regulators assessing them should keep in mind the difficult economic bargaining problem pumpers face. Hopes for effective, efficient, and sustainable water management in California depend on it.

Also posted in California, Uncategorized / Leave a comment

California Bucks Global Trend with another Year of GHG Reductions

This post was co-authored by Maureen Lackner and originally appeared on the EDF Talks Global Climate blog.

The California Air Resources Board’s November 6 release of 2016 greenhouse gas (GHG) emissions data from the state’s largest electricity generators and importers, fuel suppliers, and industrial facilities shows that emissions have decreased even more than anticipated. California’s emissions trends are showing what is possible with strong climate policies in place and provide hope even as new analysis projects that global emissions will increase by 2% in 2017 after a three-year plateau.

California’s emissions kept falling in 2016

The 2016 emissions report, an annual requirement under California’s regulation for the Mandatory Reporting of Greenhouse Gas Emissions (MRR), shows that emissions covered by the state’s cap-and-trade program are shrinking, and doing so at a faster pace than in prior years. Covered emissions have dropped each year that cap and trade has been in place, amounting to 31 million metric tons of carbon dioxide-equivalent (MMt CO2e) over the whole period, or 8.8% reduction relative to 2012. The drop between 2015 and 2016 accounts for over half of these cumulative reductions (16 MMt CO2e; 4.8% reduction relative to 2015). The electricity sector is responsible for the bulk of this drop: electricity importers reduced emissions about 10 MMt CO2e while in-state electricity generation facilities reduced emissions by about 7 MMt CO2e.

Some sectors’ emissions grew in 2016. Just as with global transportation emissions, California’s transportation emissions have steadily crept up in recent years, and the MRR report suggests this trend is continuing. Transportation fuel suppliers, which account for the largest share of total emissions, reported a 1.8 MMt CO2e increase in emissions covered by cap and trade since 2015. Cement plants and hydrogen plants also experienced small increases in covered emissions. One of the benefits of cap and trade, however, is that if the clean transition is occurring more slowly in one sector, other sectors will be required to reduce further to keep emissions below the cap while the whole economy catches up.

Emissions that are not covered by the cap-and-trade program dropped, from 92 MMt CO2e in 2015 to 87 MMt CO2e in 2016. While small, this represents the largest reduction in non-covered emissions since 2012 and is mostly driven by suppliers of natural gas/NGL/LPG and electricity importers. Net non-covered and covered emissions reductions resulted in a 20.5 MMt CO2e drop in total emissions from these sectors.

These results are a welcome reminder that the cap-and-trade program is working in concert with other policies to accomplish the primary objective of reducing emissions.

The California climate policies are accomplishing their emissions reductions goals

The 2016 MRR data indicate impactful reductions in GHG emissions and progress toward reaching the state’s target emissions reductions by 2020. The 2016 emissions drop is a consequence of several factors: a CARB analysis of the year’s electricity generation points to increased renewable capacity, decreased imports of electricity from coal-fired power plants, and increased in-state hydroelectric power production. To put it in perspective, the 20.5 MMt CO2e emissions reductions is equivalent to offsetting the energy use of about 2.2 million homes, or 16% of California’s households.

Emissions below the cap are a climate win, not a concern

Total covered emissions in 2016 were about 324 MMt CO2e, well below California’s 2016 cap of roughly 382 MMt. Some observers of the cap-and-trade program worry that an “oversupply” of credits will result in reduced revenue for the state and lesser profits for traders on the secondary market. This concern was especially pronounced when secondary market prices dipped below the price floor in 2016 and 2017.

Importantly, oversupply of allowances is not a bad thing for the climate. As Frank Wolak, an energy economist at Stanford, points out, oversupply may be a sign of an innovative economy in which pollution reductions are easier to achieve than anticipated. Furthermore, having emissions below the cap represents earlier than anticipated reductions which is a win for the atmosphere. Warming is caused by the cumulative emissions that are present in the atmosphere so earlier reductions mean gases are not present in the atmosphere for at least the period over which emissions are delayed.

While market stability is a valid concern, the design of the program has built-in features to prevent market disruptions. Furthermore, the California legislature’s recent two-thirds majority vote to extend the cap-and-trade program through 2030 provides long-term regulatory certainty. Both the May and August auctions were completely sold out suggesting that the extension has succeeded in stabilizing demand.

These results are a welcome reminder that the cap-and-trade program is working in concert with other policies to accomplish the primary objective of reducing emissions, and that we’re doing it cheaply is an added bonus. Early reductions at a low cost can lead to sustained or even improved ambition as California implements its world-leading climate targets.

As California closes its fifth year of cap and trade, it should be with a sense of accomplishment and optimism for the future of the state’s emissions.

Also posted in California, Cap and Trade Watch, Economics / Leave a comment

Alternative Facts: 6 Ways President Trump’s Energy Plan Doesn’t Add Up

Photos by lovnpeace and KarinKarin

This blog was co-authored with Jonathan Camuzeaux and is the first in an occasional series on the economics of President Trump’s Energy Plan

Just 60 days into Trump’s presidency, his administration has wasted no time in pursuing efforts to lift oil and gas development restrictions and dismantle a range of environmental protections to push through his “America First Energy Plan.” An agenda that he claims will allow the country to, “take advantage of the estimated $50 trillion in untapped shale, oil, and natural gas reserves, especially those on federal lands that the American people own.”

Putting aside the convenient roundness of this number, the sheer size of it makes this policy sound appealing, but buyer beware. Behind the smoke and mirrors of this $50 trillion is a report commissioned by the industry-backed Institute for Energy Research (IER) that lacks serious economic rigor. The positive projections from lifting oil and gas restrictions come straight from the IER’s advocacy arm, the American Energy Alliance. Several economists reviewed the assessment and agreed: “this is not academic research and would never see the light of day in an academic journal.”

Here is why Trump’s plan promises a future it can’t deliver:

1. No analytical back up for almost $20 trillion of the $50 trillion.
Off the bat, it’s clear that President Trump’s Plan relies on flawed math. What’s actually estimated in the report is $31.7 trillion, not $50 trillion, based on increased revenue from oil, gas and coal production over 37 years (this total includes estimated increases in GDP, wages, and tax revenue). The other roughly half of this “$50 trillion” number appears to be conjured out of thin air.

2. Inflated fuel prices
An average oil price of $100 per barrel and of $5.64 per thousand cubic feet of natural gas (Henry Hub spot price) was used to calculate overall benefits. Oil prices are volatile: in the last five years, they reached a high of $111 per barrel and a low of $29 per barrel. They were below $50 a barrel a few days ago. A $5.64 gas price is not outrageous, but gas prices have mostly been below $5 for several years. By using inflated oil and gas prices and multiplying the benefits out over 37 years, the author dismisses any volatility or price impacts from changes in supply. There’s no denying oil and gas prices could go up in the future, but they could also go down, and the modeling in the IER report is inadequate at best when it comes to tackling this issue.

3. Technically vs. economically recoverable resources
The IER report is overly optimistic when it comes to the amount of oil and gas that can be viably produced on today’s restricted federal lands. Indeed, the report assumes that recoverable reserves can be exploited to the last drop over the 37-year period based on estimates from a Congressional Budget Office report. A deeper look reveals that these estimates are actually for “technically recoverable resources,” or the amount of oil and gas that can be produced using current technology, industry practice, and geologic knowledge. While these resources are deemed accessible from a technical standpoint, they cannot always be produced profitably. This is an important distinction as it is the aspect that differentiates technically recoverable from economically recoverable resources. The latter is always a smaller subset of what is technically extractable, as illustrated by this diagram from the Energy Information Administration. The IER report ignores basic industry knowledge to present a rosier picture.

4. Lack of discounting causes overestimations
When economists evaluate the economic benefits of a policy that has impacts well into the future, it is common practice to apply a discount rate to get a sense of their value to society in today’s terms. Discounting is important to account for the simple fact that we generally value present benefits more than future benefits. The IER analysis does not include any discounting and therefore overestimates the true dollar-benefits of lifting oil and gas restrictions. For example, applying a standard 5% discount rate to the $31.7 trillion benefits would reduce the amount to $12.2 trillion.

5. Calculated benefits are not additional to the status quo
The IER report suggests that the $31.7 trillion would be completely new and additional to the current status quo. This is false. One must compare these projections against a future scenario in which the restrictions are not lifted. Currently, the plan doesn’t examine a future in which these oil and gas restrictions remain and still produce large economic benefits, while protecting the environment.

6. No consideration of environmental costs
Another significant failure of IER’s report: even if GDP growth was properly estimated, it would not account for the environmental costs associated with this uptick in oil and gas development and use. This is not something that can be ignored, and any serious analysis would address it.

We know drilling activities can lead to disastrous outcomes that have real environmental and economic impacts. Oil spills like the Deepwater Horizon and Exxon Valdez have demonstrated that tragic events happen and come with a hefty social, environmental and hard dollar price tag. The same can be said for natural gas leaks, including a recent one in Aliso Canyon, California. And of course, there are significant, long-term environmental costs to increased emissions of greenhouse gases including more extreme weather, damages to human health and food scarcity to name a few.

The Bottom Line: The $50 Trillion is An Alternative Fact but the Safeguards America will Lose are Real
These factors fundamentally undercut President Trump’s promise that Americans will reap the benefits of a $50 trillion dollar future energy industry. Most importantly, the real issue is what is being sacrificed if we set down this path. That is, a clean energy future where our country can lead the way in innovation and green growth; creating new, long-term industries and high-paying jobs, without losing our bedrock environmental safeguards. If the administration plans to upend hard-fought restrictions that provide Americans with clean air and water, we expect them to provide a substantially more defensible analytical foundation.

Also posted in Markets 101, Politics, Trump's energy plan / Leave a comment

How Companies Set Internal Prices on Carbon

This post was co-authored with Elizabeth Medford

Despite the uncertainty created by the recent election, companies around the globe are demonstrating a commitment to keeping climate change in check. More than 300 American companies signed an open letter to President-elect Trump urging him not to abandon the Paris agreement. Others are acting on their own to reduce emissions in their daily operations, by setting an internal price on carbon.

The number of companies incorporating an internal carbon price into their business and investment decisions has reached new heights, a recent CDP report shows, with an increase of 23 percent over last year. The more than 1,200 companies that are currently using an internal carbon price (or are planning to within two years) are using them to determine which investments will be profitable and which will involve significant risk in the future, as carbon pricing programs are implemented around the world. Sometimes, they also use them to reach emissions reduction goals.

Not all carbon prices are created equal, and companies differ in how they set their specific price. Here’s a look at some of these methods:

Incorporating Carbon Prices from Existing Policies

 Some companies set their carbon price based on policies in the countries where they operate. For example, companies with operations in the European Union might decide to use a carbon price equal to that of the European Union Emissions Trading System (EU ETS) allowances, and those operating in the Northeastern United States might adopt the carbon price that results from the Regional Greenhouse Gas Initiative market.

ConocoPhillips, for example, focuses its internal carbon pricing practices on operations in countries with existing or imminent greenhouse gas (GHG) regulation. As a result, its carbon price ranges from $6-38 per metric ton depending on the country. For operations in countries without existing or imminent GHG regulation, projects costing $150 million or greater, or that results in 25,000 or more metric tons of carbon dioxide equivalent, must undergo a sensitivity analysis that includes carbon costs.

Using Self-Imposed Carbon Fees

Others take a more aggressive approach by setting a self-imposed carbon fee on energy use. This involves setting a fee on either units of carbon dioxide generated or a proxy measurement like energy use. These programs also often include a plan for using the fees such as investment in clean energy or energy efficiency measures. This can be an effective method for incentivizing more efficient operations.

Microsoft, for example, designed its own system to account for the price of its carbon emissions. The company pledged to make its operations carbon neutral in 2012 and does so through a “carbon fee,” which is calculated based on the costs of offsetting the company’s emissions through clean energy and efficiency initiatives. Each business group within Microsoft is responsible for paying the fee depending on how much energy it uses. Microsoft collects the fees in a “central carbon fee fund” used to subsidize investments in energy efficiency, green power, and carbon offsets projects. Still, by limiting carbon fees to operational activities, Microsoft has yet to address a large chunk of their emissions.

Setting Internal Carbon Prices to Reach Emissions Reduction Targets

 Other companies set an internal carbon price based on their self-adopted GHG emissions targets. This involves determining an emissions reduction goal and then back-calculating a carbon price that will ensure the company achieves its goal by the target date. This method is a broader approach focused more on significantly reducing emissions while also mitigating the potential future risk of carbon pricing policies.

Novartis, a Swiss-based global healthcare company, uses a carbon price of $100/tCO2 and cites potential climate change impacts as a motivator. The company has its own greenhouse gas emissions target, which it is using to cut emissions to half of its 2010 levels by 2030. These internal policies mean that Novartis, which is included in the European Union’s Emissions Trading Scheme (EU ETS), has been able to sell surplus allowances and thus far avoid an increase in operating costs.

Where we go from here

 While these internal carbon pricing activities are welcome – and we hope they continue – they are not sufficient to reduce greenhouse gases to the degree our nation or world requires. Like these forward thinking companies, nations around the world, including the United States, need to consider the costs of inaction, including the climate-related costs, to avoid short-sighted investments. Ultimately, we will need public policies that put a limit and a price on carbon throughout the economy.

The spread of internal carbon pricing could signal greater support for carbon pricing by governments. But companies can do more: the ultimate test of a company’s convictions and commitment to carbon pricing might be their willingness to advocate for well-designed, ambitious policies that achieve the reductions we need.

Also posted in International, Politics / Leave a comment

Ensuring Environmental Outcomes from a Carbon Tax

How can we ensure that a carbon tax delivers on its pollution reduction potential? An innovative, new idea could provide greater certainty over the environmental outcome.

As momentum intensifies around the world for action to fight climate change, the United States is emerging as a leader in the new low-carbon economy. But if we are going to reduce climate pollution at the pace and scale required — cutting emissions 26-28% below 2005 levels by 2025 and at least 83% by 2050, on a path to zero net emissions —we need to roll up our sleeves on a new generation of ambitious climate policies that harness the power of the economy and American innovation. An emerging idea could be a game-changer for the prospects of a carbon tax to help tackle climate pollution.

Economics 101 teaches us that market-based policies, including cap-and-trade programs as well as carbon taxes, are the most cost-effective and economically efficient means of achieving results. Both put a price on carbon emissions to reduce dangerous pollution. Cap-and-trade programs place a “cap” on the total quantity of allowable emissions, directly limiting pollution and ensuring a specific environmental result, while allowing prices to fluctuate as pollution permits are traded. The “guarantee” that the cap provides is a primary reason this tool has been favored by EDF and other stakeholders focused on environmental performance. That U.S. targets are based on quantities of pollution reductions also speaks to the need for policy solutions tied to these pollution limits.

In comparison, a carbon tax sets the price per unit of pollution, allowing emissions to respond to the changes in behavior this price encourages. The problem, from an environmental standpoint, is that a carbon tax lacks an explicit connection to a desired pollution reduction target — and therefore provides no assurance that the required reductions will actually be achieved. We know that a carbon tax will impact emissions, but even the most robust modeling cannot provide certainty over the magnitude of that impact. Furthermore, fundamental factors like energy or economic market dynamics can change over time, affecting the performance of a tax. Because greenhouse gas pollution accumulates in the atmosphere over time, even being slightly off the desired path over several decades can produce significant consequences for cumulative emissions, and thus climate damages.

A new approach: Environmental Integrity Mechanisms (EIMs)

Two recently-released papers by the Nicholas Institute at Duke University and Resources for the Future (RFF) directly address this key concern with a carbon tax —and suggest an innovative path forward. They illustrate how a suite of provisions – we’ll call them “Environmental Integrity Mechanisms” or “EIMs,” though each paper uses different terminology – could provide greater levels of certainty regarding the emissions outcome, by allowing for adjustment of the carbon tax regime over time to course-correct and keep us on track for meeting our targets.

EIMs – if carefully designed – can play an important role in connecting a carbon tax to its performance in reducing pollution. They are a type of built-in insurance mechanism: they may never be triggered if the initial price path achieves its projected impact, but provide a back-up plan in case it does not.

These mechanisms are analogous to well-studied “cost containment” provisions in cap-and-trade that are designed to provide greater certainty over prices. Cost containment provisions are included in several successful cap-and-trade programs around the world. For example, California’s cap-and-trade program includes a price collar that sets a floor as well as a ceiling that triggers the release of a reserve of allowances.

EIMs are a parallel effort to introduce greater emissions certainty into a carbon tax system. With the recent publication of these two papers, EIMS are beginning to receive well-deserved greater attention. These provisions help bridge the gap between caps and taxes, merging the strengths of each to create powerful hybrid programs.

How EIMs might work

Let’s take a closer look at how these “EIMs” could work.

• First, the initial tax level and/or growth rate could be adjusted depending on performance against an emissions trajectory or carbon budget benchmark. This could occur either automatically via a simple formula built into the legislation, by Congressional intervention at a later date based on expert recommendations, or by delegation of authority to a federal or independent agency or group of agencies.

There are clear advantages to including an automatic adjustment in the legislation. This avoids having to go back to a sluggish Congress to act; and there is no guarantee that Congress would make appropriate adjustments. Moreover, Congress is likely to be loath to relinquish its tax-setting authority to an executive agency — and such delegation could even face legal challenges. Delegating tax-setting authority to an executive agency could also introduce additional political uncertainty in rate setting.

In designing such an automatic adjustment, policy makers will need to consider the type, frequency and size of these adjustments, as well as how they are triggered. The RFF paper in particular discusses some of the resulting trade-offs. For example, an automatic adjustment will reduce the price certainty that many view as the core benefit of a tax. On the other hand, by explicitly and transparently specifying the adjustments that would occur under certain conditions, a high degree of price predictability can still be maintained – with the added benefit of increased emissions certainty.

• Second, the Nicholas Institute brief discusses regulatory tools that could be employed if emission goals were not met –including existing opportunities under the Clean Air Act, or even new authority. The authors point out that relative to automatic adjustment mechanisms, regulatory options are more difficult to “fine-tune.” Nevertheless, they could provide a powerful safeguard if alternatives fail.

• Finally, as the Nicholas Institute brief discusses, a portion of tax revenue could be used to fund additional reductions if performance goals were not being met. This approach could tap into cost-effective reductions in sectors where the carbon tax might be more challenging to implement (e.g. forestry or agriculture). The revenue could also be used to secure greater reductions from sectors covered by the tax — for example, by funding investments in energy efficiency. In a neat twist, the additional revenue needed to fund these emissions reductions would be available when emissions were higher than expected — that is, precisely when more mitigation was needed.

EDF’s take

Our goal is to reduce the amount of carbon pollution we put into the atmosphere in as cost-effective and efficient a manner as possible. This means putting a limit and a price on carbon pollution.

Even at this preliminary stage in the exploration of EIM design, one takeaway is clear: all carbon tax proposals should include an EIM with an automatic adjustment designed to meet the desired emissions path and associated carbon budget.

More work is needed to develop and evaluate the range and design of EIMs. And while a cap is still the most sure-fire means of guaranteeing an emissions outcome, this growing consideration by economists and policy experts opens a new path for the potential viability of carbon taxes as a pollution reduction tool in the United States.

The bottom line is this: The fundamental test of any climate policy is environmental integrity. For a carbon tax, that means an EIM.

Also posted in Markets 101, Uncategorized / 1 Response