Market Forces

Solar power can have positive health impacts for Chile’s most vulnerable. Here’s how.

We know that solar power helps replace fossil fuel generation, getting the world closer to the international goal of keeping global warming to 1.5°C. But does it have other benefits? What happens to people’s health if we replace coal generation with solar power?
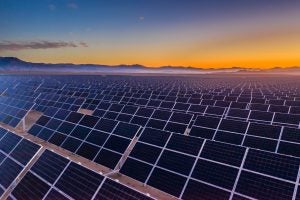
The Atacama Desert in northern Chile is one of the world’s most extreme landscapes. It is often used by NASA and film companies to stand in for Mars and is the sunniest place on Earth. It is also the best place in the world for solar power.

Since 2012, Chile has installed over 3300MW of solar power throughout the country, with a large percentage built in the regions in and surrounding the Atacama Desert. This rapid introduction of large-scale solar capacity makes the Atacama region a perfect case study for us to look at the health benefits of solar power replacing fossil fuel generation.

Due to Chile’s heavy reliance on fossil fuels, the country’s power sector releases large amounts of local air pollutants, including sulfur dioxide (SO2), nitrogen oxides (NOX), mercury (Hg) and particulate matter (PM). All of these pollutants are associated with adverse health effects, along with increased hospital admissions, mortality risks and threats to life expectancy. Annual air pollution in Chile generally exceeds life-threatening levels with daily average fine PM concentrations well above World Health Organization guidelines. Thus, Chile’s growing reliance on renewables is extremely important from a health perspective.

To that end, my co-authors and I have spent the past two years investigating the health benefits that solar generation produced in northern Chile due to this massive solar expansion. Our research found that the investments in solar capacity led to a displacement of daily coal- and gas-fired power generation. We estimated a direct, causal link between greater installed solar capacity and fewer cardiovascular and respiratory admissions due to reduced pollution from fossil fuel generation. Importantly, reductions were largest among the most vulnerable age groups: infants, children (ages 6–14), and seniors.

To estimate the effect, we relied upon wind direction to identify which cities were downwind of and close to the fossil fuel plants we found to be displaced by solar. For the populations living within 10km of displaced plants, we estimate that 1GWh of solar generation reduced annual respiratory hospital admissions by 13% on average. Similar findings, with decreasing magnitudes, occur in cities 50km and 100km downwind of displaced coal and gas-fired generation.

Our conclusions remained unchanged after several robustness checks, including the use of cities upwind of displaced facilities and those downwind of non-displaced units, as well as the use of hospital admissions of patients with diseases presumably not related to air pollution.

This research quantifies some of the benefits that solar power can provide in terms of reducing health impacts of air pollution in developing nations, yet our findings are likely an underestimate of the total health benefits that can emerge from solar generation. This is because:

  • Chile’s northern region has limited healthcare infrastructure. This means any reduction in hospitalizations increases the number of hospital beds available, which helps reduce the number of untreated unrelated injuries and illnesses.
  • Reductions in air pollution exposure for young children and infants has a lifelong benefit in terms of reduced illnesses and improved economic outcomes.
  • As demonstrated in both the US and India, disadvantaged populations often live closer to large air polluters. If this is the case, improvements in air quality may also help to reduce inequality.
  • Though the area we studied has relatively low population density, we were able to estimate a significant benefit on health outcomes- thus, solar’s contribution to cleaner air will produce even larger benefits in more populated regions or countries.     

Our research is a working paper published in the Environmental Defense Fund Economics Discussion Paper Series. You can download the paper for free here. This blog was co-authored with Nathaly M. Rivera, Research Fellow at the University of São Paulo.
Also posted in Economics / Leave a comment

Why the value of reducing health risks in China is rising

This post is a collaboration with Yana Jin

Since 2013, the Chinese government has changed its approach to regulating pollution, including providing the public greater access to information about their own exposure. This increased visibility into pollution exposure can affect citizens’ perceptions of how pollution affects their own health, and their desire to avoid these negative health outcomes. Understanding this shift in perception can tell us not only about what’s happening in China today, but also how developing countries may react to greater information about pollution.

Yana Jin, EDF’s new High-Meadows Economics Fellow, recently published a study in the Journal of Environmental Economics and Management, in which she and coauthors estimate Chinese citizens’ willingness to pay (WTP) to reduce mortality and morbidity risk associated with air pollution exposure. Specifically, the authors estimate a Value of a Statistical Life (VSL) and a Value of a Statistical Illness (VSI) of RMB 5.54 million ($1.58 million) and RMB 0.82 million ($0.23 million), which are higher than earlier estimates in China.

EDF’s Beia Spiller recently chatted with Yana about her paper and discussed the importance of the findings for policy making.

Beia: What does Value of a Statistical Life (or Value of a Statistical Illness) imply? Why do we need to put a value on human health?

Yana: The Value of a Statistical Life, VSL (or Value of a Statistical Illness, VSI) describes how much individuals are willing to pay to reduce the risk of premature death (or illnesses). Obviously, there is no market value for human health; VSL and VSI provide policymakers a common metric for valuing improvements in health outcomes.

Beia: How can VSL and VSI be used in policy making? What is the implication for environmental policy?

Yana: VSL and VSI provide a basis for conducting regulatory impact analyses and benefit cost analyses. For most environmental policies, the co-benefits of improved health outcomes dominate the total regulatory benefits (or the social cost of inactions). For example, in 2020 the total annual benefit of the Clean Air Act in the United States was estimated to be $2 trillion (in 2006 prices), more than 30 times the law’s total compliance costs; 90% of these benefits are due to reductions in mortality and morbidity attributable to ambient air pollution. This conclusion is based on an analysis using US-specific VSL and VSI estimates as part of the key parameters.

Extra attention is needed for VSI. Unlike premature mortality, which already receives lots of empirical attention, WTP for morbidity risk reductions is poorly understood in developing and developed countries. Solid VSI estimates can overcome the shortcomings of current alternative proxies in policymaking, such as the medical cost of illness and work day losses, which often undervalue the true social cost of non-fatal illnesses.

Beia: As you mention, estimates of the Value of a Statistical Life in the US (approx. $8-10 million) already exist. Why is it important from a policy perspective for this sort of analysis to be conducted for the Chinese population separately?

Yana: There is no one-size-fits-all VSL. Various factors influence VSL, including income and risk context of the affected population. Given that 92% of all pollution-related mortalities occur in developing countries, trying to draw conclusions for these populations from valuations in developed countries will involve substantial uncertainty.

Because the VSL is affected by both underlying air pollution levels and income, the VSLs will be different across China and the US. Furthermore, there are likely significant differences in the two populations’ understanding and awareness of the significance of air pollution’s impacts on health. For these reasons, we need studies based on the Chinese population and their specific setting to understand how they value risk reductions associated with improvements in air quality.

Beia: You find a much (almost 10x) smaller VSL in China than what has been estimated in the US. Does this mean that the Chinese morally value improvements in health less than populations in the US?

Yana: Not at all. Because the Chinese population currently has a much lower income than those in the US, their smaller household budgets constrain them from allocating the same amount of money to improvements in health. Though the difference in VSLs across countries seems huge right now, the VSL is highly elastic to per-capita income. This implies that as Chinese populations become richer, one can expect to see a sharp increase in Chinese VSL. Indeed, the VSL in the current study is already more than 10 times higher than early studies in the 1990s-2000s reported in China.

Beia: You test whether people have different willingness to pay to avoid specific illnesses (heart disease, stroke, or obstructive pulmonary disease) due to air pollution exposure, but find no significant differences across illness. Why is this an important policy question, and what would have been the implication for environmental policy had the opposite been true?

Yana: Whether the values across illnesses are different is of high policy relevance. For example, the risk of heart disease and stroke during extreme haze episodes is disproportionately higher than for other illnesses. If their associated VSI and VSL are also higher, this would imply that short-term policies that aim to curtail pollution spikes could be exceedingly beneficial, even though the transient effects do not reduce other more chronic, cumulative, long-term risks, which would only be affected by a steady decrease in annual average air pollution.

However, we find that the estimates are the same across illnesses. Therefore, policymakers can focus on the risk levels, and do not need to set illness-specific resource allocation priorities from the economic valuation perspective when managing air quality.

Beia: How could your VSL and VSI findings be used now?

Yana: Since 2013, the Chinese central government implemented its Air Pollution Prevention and Control Action Plan, investing 1.84 trillion RMB to improve air quality. This led to a significant drop in air pollution levels over the years in historically polluted Northern China, thereby generating marked health improvements. Our updated VSL and VSI can help to quantify and compare the observed health benefits with the costs of the policy that enabled these air quality improvements.

Also posted in china / Leave a comment

How China is cleaning up its air pollution faster than the post-Industrial UK

Beijing has seen some of the lowest air pollution levels in recent history this past winter, just as China’s Ministry of Environmental Protection (MEP) – now strengthened and renamed to Ministry of Ecology and Environment (MEE) – has put the final touches on a new, three-year plan to improve air quality. But while the trend is positive, air pollution levels in China are still dire: The MEP calculates an annual average PM2.5 concentration of 43 µg/m3 for China’s cities in 2017, more than 4 times the level of 10 µg/m3 recommended by the WHO. Official measurements for Beijing even showed the capital’s air quality at 58 µg/m3

Still, China is cleaning up its air faster than the United Kingdom did after its Industrial Revolution. Despite this early success, however, China could spark even more efficient improvements by adopting market-based incentives.

Let’s take a look at how both countries fared immediately after each of their industrial booms.

Figure notes: The figure shows annual average concentrations of total suspended particles (TSP), a coarse and now outdated measure of air pollution. The black line shows the average for China, while the grey line shows London. Data sources: TSP concentrations for China through 2003 are based on the China Energy Databook 9.0 based on data provided by State Environmental Protection Administration. From 2004 on, TSP concentrations for China are based on author-collected air pollution index (API) data from the MEP datacenter. I imputed PM10 concentrations based on information on the main pollutant on a given day and the assumption that an API reading below 51 reflects PM10 (see Stoerk 2016 for explanations on the procedure). I then converted the PM10 concentrations into TSP using a conversion factor of 2 following Matus et al. 2012. TSP concentrations for London come from Fouquet 2011, who generously shared his dataset.


Air quality in London is far from perfect, but it’s also come a long way from the days when people died in the “Great Smog.” The graphic above brings together the earliest known air pollution data from China, from 1980 to 2012, and from the UK from the Industrial Revolution until 2008. Air pollution levels in the main Chinese cities at the beginning of the 1980s were almost exactly at the level of London at the height of the Industrial Revolution in 1890 (a shocking outlier is Hohhot, the capital of Inner Mongolia, which reached a concentration of Total Suspended Particles of 1,501 µg/m3 in 1987, possibly the highest level of urban air pollution in recorded history).

The difference is in the speed of improvements: Air pollution in China has been decreasing at a similar trajectory as London’s 90 years earlier, but at twice the pace. While extreme air pollution levels in China’s recent history are typical for an industrializing economy, its pace in cleaning up the pollution is fast by historical standards.

China started to seriously control air pollution from 2006 to 2010 by limiting emissions for each province. Relying on satellite data, my research shows that this first attempt was ultimately successful in reducing nationwide SO2 emissions by over 10 percent relative to 2005. Studying compliance over time, however, suggests that reductions in air pollution only happened after the Chinese government created the MEP in 2008. After its creation, among the many changes in environmental policy, the MEP started to gather reliable SO2 emissions data from continuous emissions monitoring systems (CEMS) at the prefecture level and increased the number of enforcement officials by 17 percent (a task that EDF China actively supported).

This early success notwithstanding, China could do better by implementing well-designed market-based solutions, policies that align with the country’s ambition to combine economic prosperity and environmental protection. Or, in the words of President Xi, to combine ‘green mountains and gold mountains’.

For example, a well-designed cap-and-trade program at the province level could have decreased the cost of air pollution abatement from 2006 to 2010 by 25% according to my research. The anticipated launch of a sectoral emissions trading system to limit a portion of China’s greenhouse gas emissions suggests that the Chinese government is looking to embrace lessons learned in air pollution control and wishes to build on its own pilot market-based pollution control programs to bring its environmental policy into the 21st century.

EDF is playing a key role in helping this endeavor through both hands-on policy work and research. The timing is serendipitous: China is at a cross-roads in environmental policy. Evidence based policy making is welcome. And data quality has improved in recent years. Given the right set of policies, countries can control air pollution, and improvements in air quality typically go hand in hand with economic prosperity.

Both China and London have remaining challenges. Despite dramatic improvements, Londoners, like the Chinese, still live with significant air pollution. A recent report on London’s air pollution found the city is not close to meeting WHO standards. Meeting them will be a challenge, in part because of the complexity of the causes (road transport accounts for over half of local contributions). So just as London must keep battling to improve air quality, Beijing will need to do likewise–but at least now each can now learn from the other.

Also posted in china, International / Leave a comment