Flaws found in EPA’s lead pipe survey of states and water utilities
Written By

Share
Deep Dive: Read our Deep Dives blog for an in-depth analysis on the data that drove the 2023 allocation of federal funding for lead service line replacements.
What’s New: EPA recently estimated there are 9.2 million lead service lines (LSLs) in the nation’s drinking water infrastructure based on information reported by states and water utilities. This was collected as part of a survey conducted every four years to understand drinking water infrastructure needs.
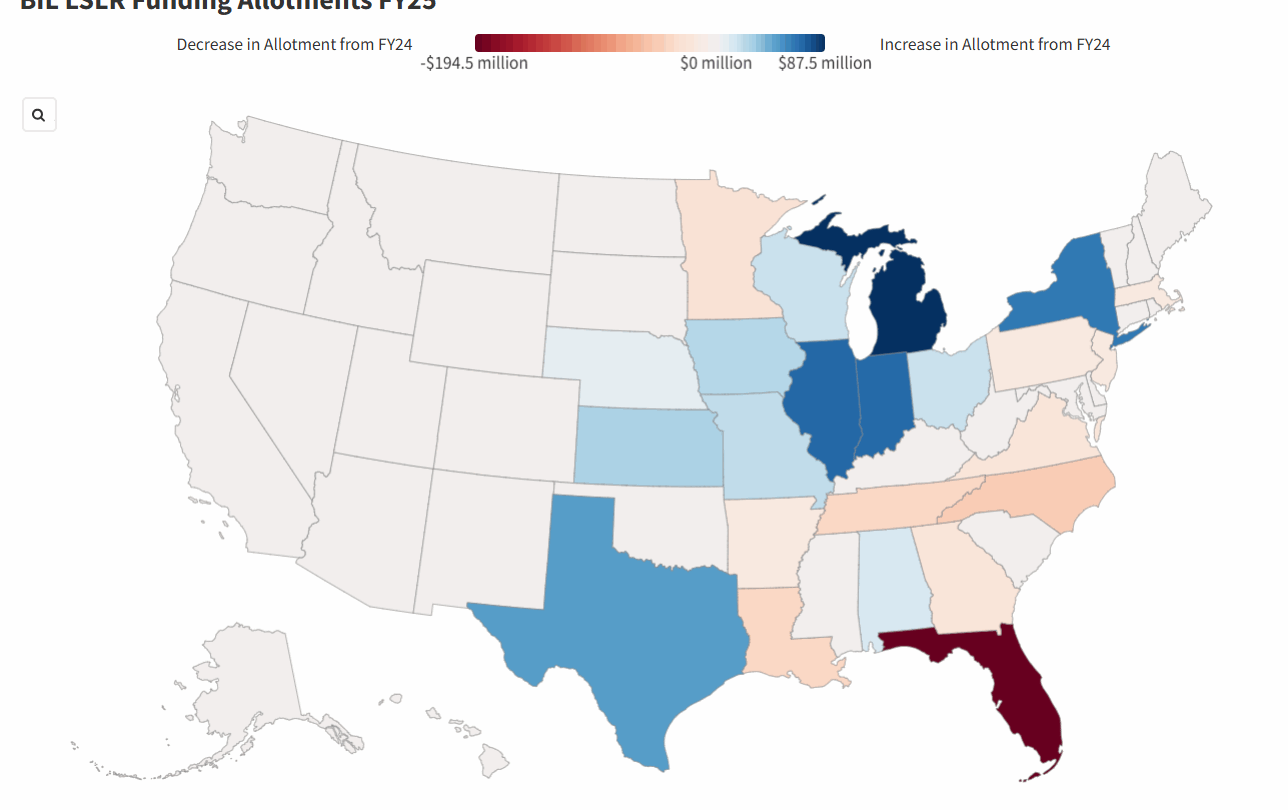
The agency estimated the number of LSLs for each state. Two had surprisingly high numbers: Florida with 1.2 million LSLs and Texas with 650,000.
After reviewing data EPA used to estimate each state’s totals[1], we believe that these two may have less than 100,000 LSLs each. If true, this means the country may actually have about 1.6 million fewer LSLs than originally thought – good news overall.
Why It Matters: EPA used the estimated LSLs for each state to allocate a share of the $3 billion dedicated to LSL replacement in this fiscal year. The allocations are already set for FY23 but could be adjusted for the next three years.
Next Steps: This fall, states and utilities will have the opportunity to resubmit their responses, a decision made by EPA that we applaud. We believe this will lead to a more equitable allocation of LSL replacement funding for the next three years.
[1] This data is readily available because of a Freedom of Information Act (FOIA) submission by the Natural Resources Defense Council seeking the survey responses.