New Graphics from DOE Illustrate the Energy-Water-Land Nexus
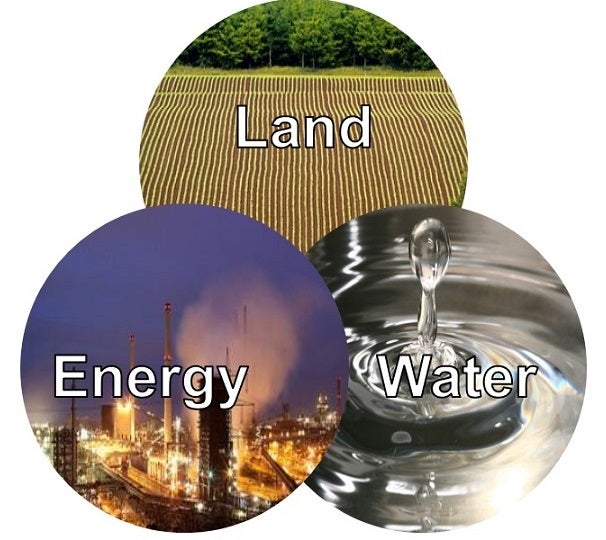
 I’ve talked a lot about the inextricable link between the energy and water sectors, but land is a third component in this nexus that’s starting to gain recognition – and the U.S. Department of Energy (DOE) is taking note. In fact, they recently released a 250-plus page report on the energy-water nexus (which I explore in-depth in a recent blog post) with accompanying visuals to illustrate the connection between these three sectors.
What is a Sankey diagram?
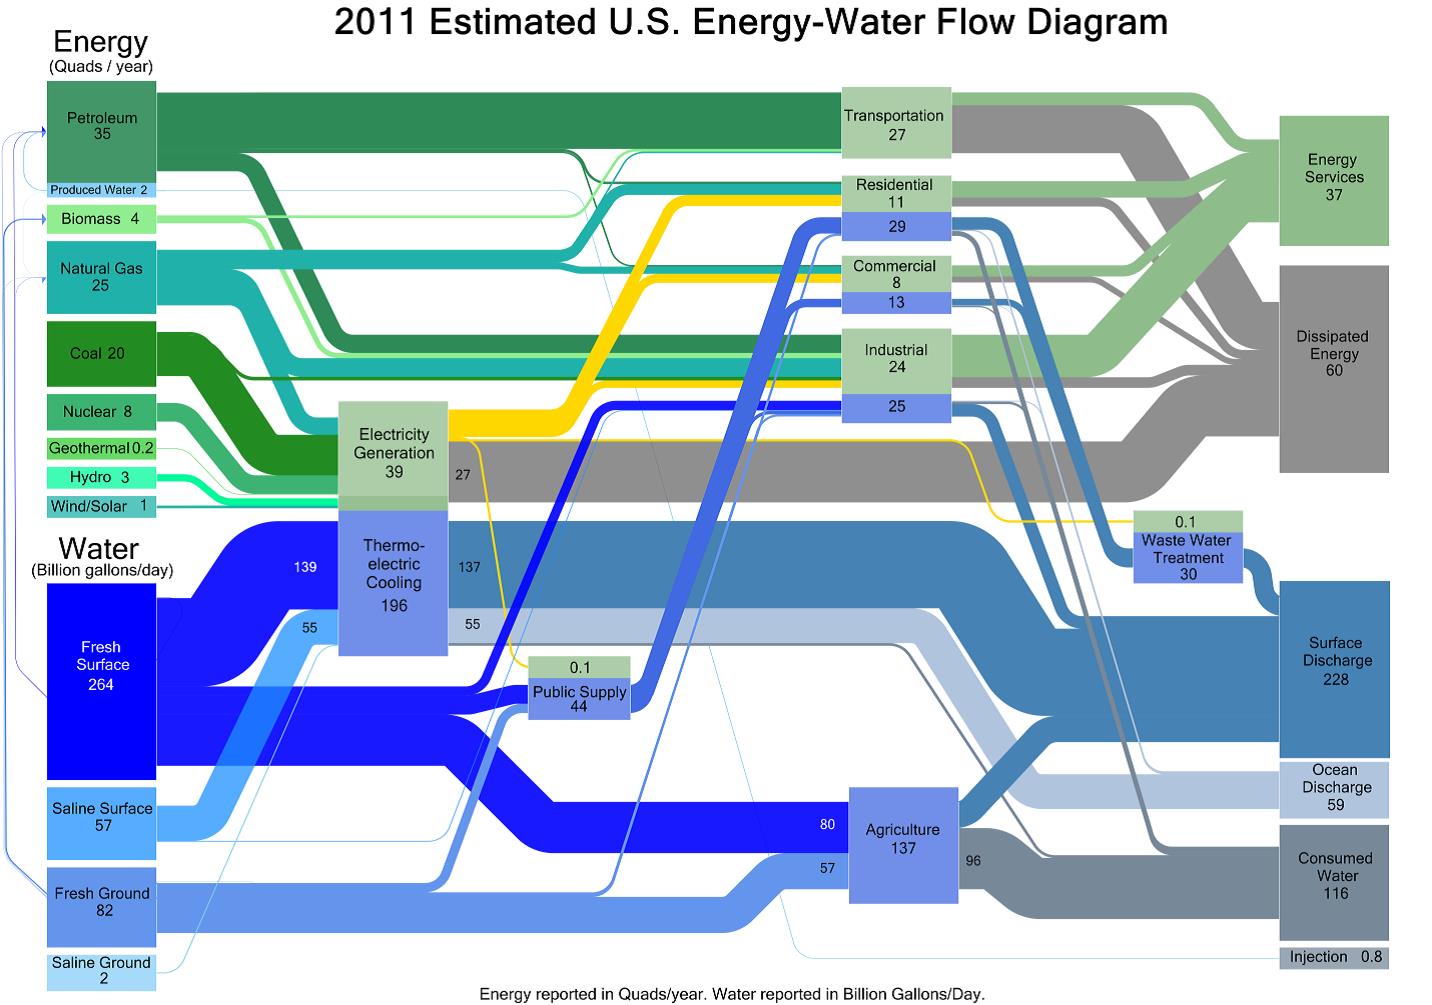
The primary graphic used to illustrate the connection between these three resources is the Sankey diagram. At first glance, it may make your head spin, but Sankey diagrams are commonly used to visualize energy transfers (although they are also used for other things, such as migration flows).
For example, the Energy Information Agency (EIA) uses Sankey diagrams in its Annual Energy Reports to illustrate the production and consumption of different energy sources. Since the width of the arrows corresponds with quantity, the viewer can easily see where the biggest impacts lie. In this case, it’s clear to see which energy resources are gulping down our water.
The Water-Energy Sankey Diagram
Note: Water is measured in billions of gallons per day (BGD) and energy is measured in quadrillion British Thermal Units (Quads) per year. In the graphic above, water flows are represented in blue, energy in green.
The magnitude of water withdrawals for thermoelectric power generation (think fossil fuel-fired and nuclear power plants) is very apparent in the graph above. Also, a great inefficiency is visible with the large amounts of primary energy lost when converted to electricity.
Though it may be hard to decipher, the Sankey diagram also includes the land connection; it’s just folded into the agriculture portion. Nationally, agriculture is the largest single water consumer, thereby competing directly with the energy sector. Climate change will likely worsen drought conditions in our agriculture-heavy states, like California, exacerbating this competition.
It’s also important to note that this diagram only represents a snapshot in time. As different technologies and resources are deployed, like less-water intensive power plant cooling and low water-intensive solar PV and wind energy, these flow amounts will change. Furthermore, less water availability due to competition with other users, such as cities and agriculture, and effects of climate change, like drought, will spur the energy sector to innovate and create water-efficient technologies.
Another Way of Looking At It
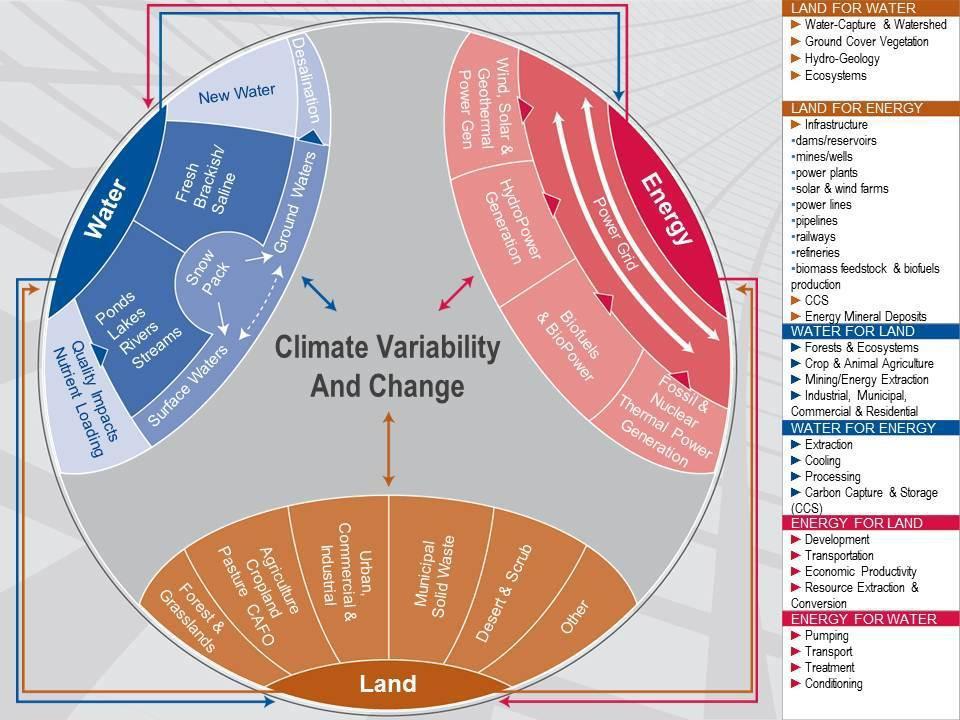
The Sankey diagram is a technical diagram with specific measurements broken down by sector, and that may not be the best visual representation for all users. A more easily-digestible graphic may be the integrated energy-water-land figure, also in the DOE report.
This graph provides a more qualitative visualization of the energy-water-land nexus, and the examples given in the right-hand column are particularly useful for thinking through all of the potential interconnections between these fragile resources.
Land is now being considered an important part of the energy-water nexus and these visuals from the DOE report do a great job of illustrating this connection. Although climate change is making it harder than ever for policymakers across the energy, water, and land sectors to plan for an uncertain future, it takes creative thinking – like what’s exhibited in these graphics – to begin approaching this challenge in a more holistic way.
Lead images from Flickr: Ian Sane, Dave Heuts, Foto_Michel


2 Comments
It is high time USDOE recognizes the inextricable link between energy, water and land
Thanks for your comment, Kenell. We definitely agree. It’s great to see DOE taking a leadership role in this realm.