Market Forces

What California’s history of groundwater depletion can teach us about successful collective action

California’s landscape will transform in a changing climate. While extended drought and recent wildfires seasons have sparked conversations about acute impacts today, the promise of changes to come is no less worrying. Among the challenges for water management:

These changes will make water resources less reliable when they are needed most, rendering water storage an even more important feature of the state’s water system.

One promising option for new storage makes use of groundwater aquifers, which enable water users to smooth water consumption across time – saving in wet times and extracting during drought. However, when extraction exceeds recharge over the long term, “overdraft” occurs. Falling water tables increase pumping costs, reduce stored water available for future use, and entail a host of other collateral impacts. Historically, California’s basins have experienced substantial overdraft.

Falling water tables reflect inadequate institutional rules

One cause of the drawdown is California’s history of open-access management. Any landowner overlying an aquifer can pump water, encouraging a race to extract. Enclosing the groundwater commons and thereby constraining the total amount of pumping from each aquifer is critical for achieving efficient use and providing the volume and reliability of water storage that California will need in the future. However, despite evidence of substantial long-run economic gain from addressing the problem, only a few groups of users in California have successfully adopted pumping regulations that enclose the groundwater commons.

SMGA addresses overdraft—but pumpers must agree to terms

California’s Sustainable Groundwater Management Act (SGMA) of 2014 aims to solve this challenge by requiring stakeholders in overdrafted basins to form Groundwater Sustainability Agencies (GSAs) and create plans for sustainable management. However, past negotiations have been contentious, and old disagreements over how best to allocate the right to pump linger. The map presented below illustrates how fragmentation in (historical) Groundwater Management Plans also tracks with current fragmentation in Groundwater Sustainability Agencies (GSAs) under SGMA. Such persistent fragmentation suggests fundamental bargaining difficulties remain.

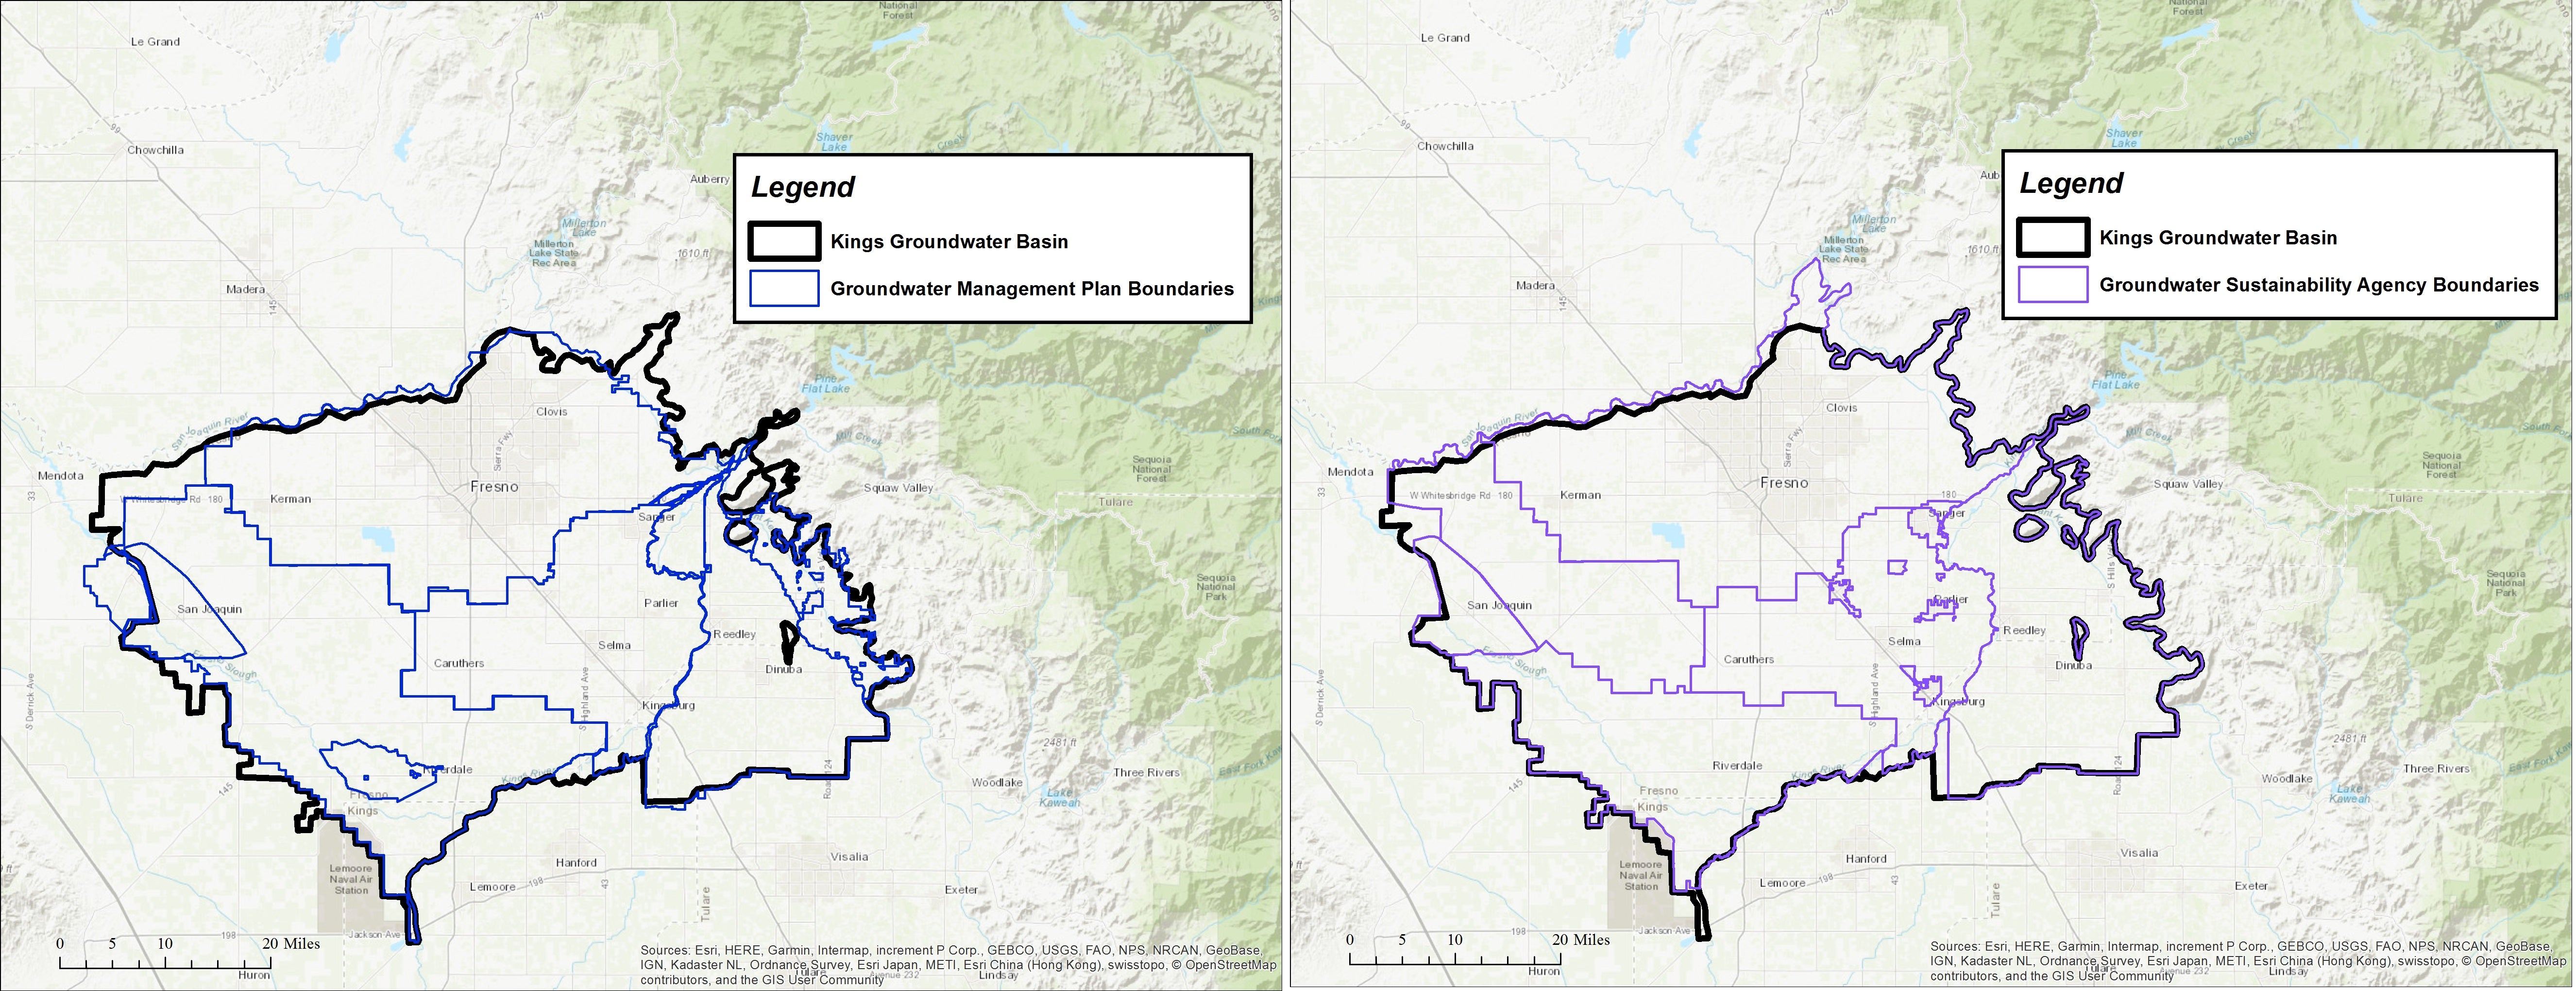
Spatial boundaries of self-selected management units within basins under SGMA (GSAs) mirror those of previous management plans (GMPs). Persistent fragmentation may signal that adoption of SGMA doesn’t mean the fundamental bargaining difficulties facing the basin users have disappeared.

New research, co-authored with Eric Edwards (NC State) and Gary Libecap (UC, Santa Barbara) and published in the Journal of Environmental Economics and Management, provides broad insights into where breakdowns occur and which factors determine whether collective action to constrain pumping is successful. From it, we’ve gleaned four suggestions for easing SGMA implementation.

Understanding the costs of contracting to restrict access

To understand why resource users often fail in adopting new management institutional rules, it’s important to consider the individual economic incentives of various pumpers. Even when they broadly agree that groundwater extraction is too high, collective action often stalls when users disagree about how to limit it. When some pumpers stand to lose economically from restricting water use, they will fight change, creating obstacles to addressing over-extraction. When arranging side payments or other institutional concessions is difficult, these obstacles increase the economic costs of negotiating agreement, termed “contracting costs.”

To better understand the sources of these costs in the context of groundwater, we compare basins that have adopted effective institutions in the past with otherwise similar basins where institutions are fragmented or missing. Even when controlling for the level of benefits, we found that failures of collective action are linked to the size of the basin and its user group, as well as variability in water use type and the spatial distribution of recharge. When pumpers vary in their water valuation and placement over the aquifer, the high costs of negotiating agreement inhibit successful adoption of management institutions, and overdraft persists. Indeed, in many of California’s successfully managed basins, consensus did not emerge until much farmland was urbanized, resulting in a homogenization of user demand on the resource.

Four key takeaways to ease agreement

In the face of such difficult public choices, how can pumpers and regulators come to agreement? Four main recommendations result from our research:

  • Define and allocate rights in a way that compensates users who face large losses from cutbacks in pumping. Tradable pumping rights can help overcome opposition. Pumpers can sell unused rights and are oftentimes made better off. The option to sell also incentivizes efficient water use.
  • Facilitate communication to reduce costs of monitoring and negotiations. The Department of Water Resources has already initiated a program to provide professional facilitation services to GSAs.
  • Promote and accept tailored management. Stakeholders and regulators should remain open to approaches that reduce contracting costs by addressing issues without defining allocations or attempting to adopt the most restrictive rules uniformly throughout the basin. For example, pumpers have successfully adopted spatially restricted management rules to address overdraft that leads to localized problems; others have adopted well-spacing restrictions that reduce well interference without limiting withdrawals.
  • Encourage exchange of other water sources. Imported, non-native surface water may lower contracting costs because it can save users from large, costly cutbacks. Pumpers have written contracts to share imported water in order to avoid bargaining over a smaller total pie; where such water is available, exchange pools (such as those described here) can help to limit the costs of adjustment.

SMGA is a large-scale public experiment in collective action. To avoid the failures of previous attempts to manage groundwater, stakeholders crafting strategies for compliance and regulators assessing them should keep in mind the difficult economic bargaining problem pumpers face. Hopes for effective, efficient, and sustainable water management in California depend on it.

Also posted in Uncategorized / Leave a comment

California Bucks Global Trend with another Year of GHG Reductions

This post was co-authored by Maureen Lackner and originally appeared on the EDF Talks Global Climate blog.

The California Air Resources Board’s November 6 release of 2016 greenhouse gas (GHG) emissions data from the state’s largest electricity generators and importers, fuel suppliers, and industrial facilities shows that emissions have decreased even more than anticipated. California’s emissions trends are showing what is possible with strong climate policies in place and provide hope even as new analysis projects that global emissions will increase by 2% in 2017 after a three-year plateau.

California’s emissions kept falling in 2016

The 2016 emissions report, an annual requirement under California’s regulation for the Mandatory Reporting of Greenhouse Gas Emissions (MRR), shows that emissions covered by the state’s cap-and-trade program are shrinking, and doing so at a faster pace than in prior years. Covered emissions have dropped each year that cap and trade has been in place, amounting to 31 million metric tons of carbon dioxide-equivalent (MMt CO2e) over the whole period, or 8.8% reduction relative to 2012. The drop between 2015 and 2016 accounts for over half of these cumulative reductions (16 MMt CO2e; 4.8% reduction relative to 2015). The electricity sector is responsible for the bulk of this drop: electricity importers reduced emissions about 10 MMt CO2e while in-state electricity generation facilities reduced emissions by about 7 MMt CO2e.

Some sectors’ emissions grew in 2016. Just as with global transportation emissions, California’s transportation emissions have steadily crept up in recent years, and the MRR report suggests this trend is continuing. Transportation fuel suppliers, which account for the largest share of total emissions, reported a 1.8 MMt CO2e increase in emissions covered by cap and trade since 2015. Cement plants and hydrogen plants also experienced small increases in covered emissions. One of the benefits of cap and trade, however, is that if the clean transition is occurring more slowly in one sector, other sectors will be required to reduce further to keep emissions below the cap while the whole economy catches up.

Emissions that are not covered by the cap-and-trade program dropped, from 92 MMt CO2e in 2015 to 87 MMt CO2e in 2016. While small, this represents the largest reduction in non-covered emissions since 2012 and is mostly driven by suppliers of natural gas/NGL/LPG and electricity importers. Net non-covered and covered emissions reductions resulted in a 20.5 MMt CO2e drop in total emissions from these sectors.

These results are a welcome reminder that the cap-and-trade program is working in concert with other policies to accomplish the primary objective of reducing emissions.

The California climate policies are accomplishing their emissions reductions goals

The 2016 MRR data indicate impactful reductions in GHG emissions and progress toward reaching the state’s target emissions reductions by 2020. The 2016 emissions drop is a consequence of several factors: a CARB analysis of the year’s electricity generation points to increased renewable capacity, decreased imports of electricity from coal-fired power plants, and increased in-state hydroelectric power production. To put it in perspective, the 20.5 MMt CO2e emissions reductions is equivalent to offsetting the energy use of about 2.2 million homes, or 16% of California’s households.

Emissions below the cap are a climate win, not a concern

Total covered emissions in 2016 were about 324 MMt CO2e, well below California’s 2016 cap of roughly 382 MMt. Some observers of the cap-and-trade program worry that an “oversupply” of credits will result in reduced revenue for the state and lesser profits for traders on the secondary market. This concern was especially pronounced when secondary market prices dipped below the price floor in 2016 and 2017.

Importantly, oversupply of allowances is not a bad thing for the climate. As Frank Wolak, an energy economist at Stanford, points out, oversupply may be a sign of an innovative economy in which pollution reductions are easier to achieve than anticipated. Furthermore, having emissions below the cap represents earlier than anticipated reductions which is a win for the atmosphere. Warming is caused by the cumulative emissions that are present in the atmosphere so earlier reductions mean gases are not present in the atmosphere for at least the period over which emissions are delayed.

While market stability is a valid concern, the design of the program has built-in features to prevent market disruptions. Furthermore, the California legislature’s recent two-thirds majority vote to extend the cap-and-trade program through 2030 provides long-term regulatory certainty. Both the May and August auctions were completely sold out suggesting that the extension has succeeded in stabilizing demand.

These results are a welcome reminder that the cap-and-trade program is working in concert with other policies to accomplish the primary objective of reducing emissions, and that we’re doing it cheaply is an added bonus. Early reductions at a low cost can lead to sustained or even improved ambition as California implements its world-leading climate targets.

As California closes its fifth year of cap and trade, it should be with a sense of accomplishment and optimism for the future of the state’s emissions.

Also posted in Cap and Trade, Cap and Trade Watch, Economics / Leave a comment

Creating Incentives for Agricultural GHG Abatement

One of the goals of EDF’s Ecosystems work is to provide farmers with revenue opportunities in reducing their greenhouse gas (GHG) footprint. Under AB32, California’s landmark legislation aimed at reducing GHG emissions, regulated entities may purchase carbon offsets to meet up to 8% of their obligations. Over the past six years, EDF has worked closely with growers to capitalize on the anticipated demand for these offsets, by developing protocols that will allow landowners to generate and sell agricultural offsets. On March 28, we reach a milestone in these efforts: the California Air Resources Board will host a workshop to begin a rulemaking process to consider the adoption of an offset protocol EDF has developed with the American Carbon Registry, crediting rice producers for GHG abatement practices.

We’ve put a great deal of work into understanding and piloting a myriad of rice farming techniques, while studying their implications for GHG emissions. A major conclusion from our analysis is that there exists a subset of viable alternative practices for rice producers in California with potential agronomic, economic and environmental benefits. The ones we’ve decided to focus on for our offset protocol are: baling, dry seeding, and early drainage of fields before harvest.

Agricultural activities account for an estimated 12% of global GHG emissions – the majority of these arise from sources of nitrous oxide and methane gases, composing ~60% and ~50% of the global total, respectively (as of IPCC AR4). Rice cultivation accounts for 5-20% of worldwide methane emissions; much of it is emitted as a byproduct of organic decomposition under flooded paddies. California’s goal to reduce its emissions to 1990 levels by 2020 through its cap-and-trade program (AB32) provides an opportunity for rice farmers to help the state meet its reduction goal.

There are multiple approaches for rice farmers to reduce GHG emissions. Some of these practices can be carried out before the harvest and others post-harvest. We’ve carried out some in-depth analysis on the various options, to better understand the incentives and revenue possibilities we will be encouraging through our policy work – we have found that there are a handful of ways that farmers can reduce GHG emissions while maintaining yields, earning some revenue for their efforts, and potentially save on costs in some circumstances.

Our analysis builds on a prior study by our partners Applied Geosolutions, UC Davis and the California Rice Commission that estimates GHG emissions and yields for the majority of rice producing acreage in the state. They use the DeNitrification-DeComposition (DNDC) model, simulating 6,316 rice fields for 16 farming practices. In our analysis, we first estimate the potential greenhouse gas abatement of a suite of specific practices: dry seeding the rice fields, baling harvest residue, and hydroperiod adjustments (draining of fields in midseason, before harvest and/or reducing winter flooding).

We then tabulate the cost of each management practice through a combination of literature, farmer and farm advisor consultation and combine these with abatement estimates to generate marginal abatement cost curves for each practice. Our preliminary results indicate a wide variability in abatement costs, depending on farming conditions. Of course, this is before factoring in the role of a carbon credit.

Unfortunately, not all of the practices we’ve studied are tenable in the Californian setting. One practice (midseason drainage of the fields) is accompanied with a significant decrease in yield and therefore does not lend itself well to the Sacramento Valley climate. In the case of stopping winter flooding, there could be negative habitat impacts for waterfowl that use this ecosystem as a feeding ground. Striving to understand such risks has been crucial in determining the extent to which producers will consider the new incentives created through the market.

Because the practices listed above have not been widely adopted, they are key opportunities for the generation of offsets.  To better understand adoption rates, EDF is conducting further research in determining the quantitative and qualitative barriers that are limiting farmers from adopting such farming methods.

California will be one of the first rice producing regions in the U.S. to present abatement opportunities in conjunction with a carbon market. Combining economic principles such as abatement cost curves with biogeochemical models (e.g. DNDC) is useful in studying such opportunities. Further, the ability to simulate practices at the field level is central to understanding the economic potential of offset protocols granting agricultural producers access to carbon markets. In turn, this can create new incentives to abate GHG emissions from agriculture while potentially providing new sources of revenue to landowners – potentially a win-win situation.

We are excited that Thursday’s California Air Resources Board workshop will kick off the rulemaking process and that farmers can soon benefit from these interesting prospects.

Also posted in Cap and Trade, Climate science / Leave a comment

Capping Pollution from Coast to Coast

As the second auction in California’s landmark cap and trade program approaches, a coalition of states on the opposite side of the country – that have been cost-effectively reducing their carbon pollution while saving their consumers money – announced plans to strengthen their emission reduction goals.  Last week, the Regional Greenhouse Gas Initiative (RGGI) – the nation’s first cap and trade program which sets a cap on carbon dioxide pollution from the electric power sector in 9 Northeastern states (Connecticut, Delaware, Maine, Maryland, Massachusetts, New Hampshire, New York, Rhode Island, and Vermont) – released an updated Model Rule containing a number of improvements to the program, primarily a significantly lower (by 45%) overall cap, realigning it with current emissions levels.

Since the program took effect in 2009, emission reductions in the RGGI region have occurred faster and at lower cost than originally expected.  This has primarily been the result of increased electric generation from natural gas and renewables which have displaced more carbon-intensive sources like coal and oil, as well as investments in energy efficiency that lower overall electricity demand.  These reductions have been accompanied by lower electricity prices in the region (down 10% since the program began) and significant economic benefits:  a study from the Analysis Group estimated that electric consumers would save $1.1 billion on their bills over 10 years from the energy efficiency improvements funded by allowance revenue, and further, that these savings would generate over $1.6 billion in economic benefits for the region.

The new lower cap allows RGGI to secure the reductions already achieved, and push forward towards more ambitious pollution reduction goals.  The changes to the program are the result of a transparent and comprehensive program review process set in motion through RGGI’s original Memorandum of Understanding – a mechanism that is successfully fulfilling its original intention by allowing the states to evaluate results and make critical improvements.

While the changes will go a long way to fortify the program, there is room in the future for the RGGI states to look to California’s strong program design for additional enhancements.  For example, RGGI’s updated Model Rule creates a Cost Containment Reserve (CCR) – a fixed quantity of allowances which are made available for sale if allowance prices exceed predefined “trigger prices”.  A CCR is a smart design feature which provides additional flexibility and cost containment – however, RGGI’s CCR allowances are designed to be additional to the cap, rather than carved out from underneath it as in CA’s program (ensuring the overall emission reduction goals will be met).  California’s program has displayed enormous success already, with a strong showing in their first auction.

In the meantime, the RGGI states should be commended for their success thus far, and for their renewed leadership as they take important steps to strengthen the program.  These states have achieved significant reductions in emissions of heat-trapping pollutants at lower costs than originally projected, all while saving their citizens money and stimulating their economies, transitioning their power sector towards cleaner, safer generation sources, and laying a strong foundation for compliance with the Carbon Pollution Standards for power plants being developed under the Clean Air Act.  Such impressive achievements provide a powerful, concrete example of how to tackle harmful carbon pollution and capture the important co-benefits of doing so.

The bottom line is that cap and trade is alive and well on both coasts as the states continue to lead the charge on tackling climate change in the U.S. while delivering clear economic benefits.

Also posted in Cap and Trade, Cap and Trade Watch, Clean Air Act, Markets 101, Politics / Leave a comment

Not the U.S. or China, but the U.S., China and the Planet

One of the pleasures of my job is having a slew of superbly qualified prospective interns knock on our doors. Yesterday, I interviewed someone who graduated at the top of his class at Renmin University in Beijing.

There have been plenty of column inches written on “China versus the US,” including when it comes to green jobs and clean tech. So,

Who’s going to come out ahead, China or the United States?

It took him nary a second to nail this one:

China, relatively. Both China and the U.S. in an absolute sense.

That’s the textbook answer.

The atmosphere wins

China has a lot of catching up to do. Comparatively, it will clearly gain on the U.S. But trade also has advantages for both parties involved. That’s why we trade in the first place.

The planet emerges as a winner as well. It doesn’t care where a ton of carbon gets emitted or where it gets reduced—just that reductions happen.

If China produces cheaper solar panels, we get fewer emissions overall. The planet wins. China wins. What about the U.S.?

What about jobs?

If you are among the 800 workers in Devens, MA, who last week found out that Evergreen Solar was moving its plant to China, you will feel very differently about free trade right about now. The textbook economic answer would say that the move can still make everyone better off: compensate the losers through portions of the gains from the winners, and everybody wins once again.

This situation, of course, is the moment when you throw out your textbook and think about the full consequences.

As a result of the move, solar panels will likely become even cheaper for everyone, enabling many more to buy them. Still, the Devens 800 will not be among the people lining up to buy cheaper solar panels.

What can they do? What should the U.S. do as a matter of policy?

First, we need to realize that the rules of trade still apply. China has lots of cheap labor. It does and will continue to manufacture many products sold in the U.S. Solar panels are no different.

But that’s still not a satisfying answer, nor is it the whole story—not for manufacturing itself, and not for the clean tech industry overall.

How to keep clean tech jobs in the U.S.

To get to the bottom of this, we need to look at the full supply chain for solar panels. This, of course, oversimplifies things, but we can split the entire process into three distinct buckets: inventing, producing, and installing.

Right now, the U.S. is inventing, China is producing, and it is the one installing the resulting solar panels domestically at massive scale.

The U.S. ought to do everything to make sure it keeps inventing clean tech products. That means a concerted push to fund basic research and development. But R&D subsidies alone won’t do.

Many mentions of “R&D” add a second “D” for deployment. Government support can get things going, but large-scale deployment of clean technologies won’t happen through subsidies alone (at least not without bankrupting the government).

So how do you get deployment up to scale?

Deployment clearly needs to be driven by demand. That’s where a cap on carbon pollution, with its resulting price on carbon, comes in. A cap helps create a more level playing field for solar and other renewable energy sources relative to fossil energy and, therefore, creates the necessary demand. (There are alternatives, like simply requiring a certain percentage of power to come from solar, but none is quite as cheap and flexible as a cap.)

Made in USA?

Moreover, cheap labor and cheaper production facilities may be a decisive factor, but they are not the only reason companies consider when choosing where to locate. There are many more, but let’s focus on two: intellectual property (IP) protection and being close to where the demand is.

The U.S. has a leg up on China in terms of IP protection. That’s, in part, why the U.S. (still) leads on R&D. It’s also a clear draw for some companies to locate their production facilities in the U.S.

Another oft-cited reason is to be close to consumers. That’s once again where the importance of the second “D”—deployment—comes in. The more demand there is for solar panels in the U.S., the more companies will locate their production plants in the U.S. as well. The case of First Solar supplying panels for Wal-Mart is a prime example. (Note that this is distinct from cheaper production leading to more demand in the first place.)

In the end, though, we must also be clear that jobs will be different in the new, cleaner economy. We will need fewer gas station attendants. Many other jobs will thrive. Underlying trade forces will mean that China may well be producing many of the solar panels sold globally. Assembling, installing, and maintaining solar panels in the U.S. will require plenty of skilled labor. And none of these jobs can be exported.

California leading

With the right policies in place, the U.S. will keep inventing. It will also create thousands of jobs dedicated to deployment. China will play a major role in producing, but even there, smart environmental policy can only help.

California is taking the lead with its Million Solar Roofs initiative, creating many a job assembling, installing, and maintaining solar panels. That initiative, though, still has to be paid for by tax dollars, and it won’t go on forever.

That’s where the cap on carbon kicks in. California is bound to stay ahead of the rest of the U.S. with its ambitious cap-and-trade system that starts on January 1, 2012 and the resulting market signal that says that clean tech pays in the U.S. as well.

Consider the just-released Next 10 report, Many Shades of Green, that found that in the most recent observable 12-month period (January 2008 – January 2009) jobs in the green sector grew more than three times faster than total employment in California. (Of course, all of this always comes with the warning that green sector jobs are still a small fraction of total jobs—much like IT jobs were a minuscule part of overall employment in the early 1980s.)

One of our internship spot may well end up going to a Chinese student, but that, too, can only be good for the planet—making a small contribution to help train the next generation of Chinese environmental leaders. And rest assured, there are plenty more open job positions (including one for a post-doc working with our economic team, open to anyone with a Princeton affiliation).

Also posted in International, Markets 101, Politics / Leave a comment

First steps for the California carbon trading market

Whoever said cap and trade is dead hasn’t been paying attention to the news in California.

Recently, the first trade of a greenhouse gas emissions permit in the Golden State took place, signaling the beginning of what experts project to be a robust carbon market—and the largest in the U.S. given the absence of a nation-wide policy (note that the Regional Greenhouse Gas Initiative (RGGI), the first mandatory market-based effort in the U.S. with 10 participating Northeastern states, applies to utilities, while California’s program will also apply to industry and in later years, transportation).  The trade takes place hot on the heels of the defeat of Proposition 23 in the November elections.

Although the compliance market won’t launch until 2012, Barclays Bank and NRG Energy completed the first allowance trade:  a forward contract which guarantees the delivery of allowances valid for use in the California market at the start of the program at a locked-in price (around $11-$11.50 according to Point Carbon).  By helping provide certainty about the future, these types of trades allow firms to make smart business planning decisions, such as which energy technologies to invest in.  Experts at Barclays as well as at San Francisco-based CantorCO2 expect that other early trades are soon to follow, as firms look for ways to reduce risk and start transitioning to a clean energy economy.

Ensuring the integrity of the carbon market…

State regulators have been able to provide sufficient certainty about how the market will be structured and the timeline for regulatory action to allow for this early launch of the California market.  However, it will be important to nail down sooner rather than later the nitty-gritty specifics of how the market will be regulated in order to ensure that trading occurs in an efficient and transparent way (note that the California Air Resources Board (CARB) is currently accepting comments on a detailed rule proposal).

The financial crisis we just lived through should provide ample incentive for us to make sure to get the rules right and for ensuring tough enforcement and strong oversight — for example, by requiring all carbon trading to be done on registered exchanges, rather than over the counter.  On that point, it’s worth noting that the recently passed Dodd-Frank Financial Reform legislation requires the Commodities Futures Trading Commission (CFTC) to lead an interagency study on how best to regulate the carbon market.  (Carl Royal’s 2009 testimony from the House Energy & Commerce Committee hearing on the American Clean Energy and Security Act and our own fact sheet provide some more arguments).

The path forward for CA

California’s cap-and-trade program will cover the power and industrial sectors starting in 2012 and the transportation sector (including cars and fuels) beginning in 2015.  Time and time again, California and other regional initiatives, like RGGI, continue to lead the nation on sensible energy and climate policy (and stay tuned for developments in the Western Climate Initiative (WCI) as well as New Mexico).  Time for Washington to catch up.

Also posted in Cap and Trade Watch, Markets 101 / Leave a comment