


Tom Neltner, J.D., is Chemicals Policy Director and Dr. Ananya Roy is Health Scientist
This week, Environmental Health Perspectives published an important article by scientists at the Environmental Protection Agency (EPA) that sheds important light on the various sources of children’s lead exposure. Led by Valerie Zaltarian, the article shares an innovative multimedia model to quantify and compare relative contributions of lead from air, soil/dust, water and food to children’s blood lead level. The model couples existing SHEDS and IEUBK models to predict blood lead levels using information on concentrations of lead in different sources, intake and gut absorption. The predicted blood lead levels compared well with observed levels in the National Health and Nutrition Evaluation Survey population. Given the variety of independent sources of lead exposure, the model provides a critical tool that public health professionals can use to set priorities and evaluate the impact of various potential standards for all children and not just those with the greatest exposure.
This peer-reviewed article builds on a draft report EPA released in January 2017 evaluating different approaches to setting a health-based benchmark for lead in drinking water. The report has provided a wealth of insight into a complicated topic. Earlier this year, we used it to show that formula-fed infants get most of their lead exposure from water and toddlers from food, while the main source of lead for the highest exposed children is soil and dust. In our February blog, we provided our assessment of a health-based benchmark for lead in drinking water and explained how public health professionals could use it to evaluate homes. The information was also critical to identifying lead in food as an overlooked, but meaningful, source of children’s exposure to lead.
The new article reaffirms the analysis in the January 2017 EPA report and highlights that evaluating source contribution to blood lead in isolation versus aggregating across all sources can lead to very different answers and priorities. A health-based benchmark for lead in drinking water could vary from 0 to 46 ppb depending on age and whether all other sources of lead are considered. For example, a health-based benchmark for infants (birth to six months old) would be 4 ppb or 13 ppb depending on whether or not you consider all sources of exposure.
Further, the model shows how the relative contribution of different sources of lead vary by age and reveals that the priority intervention for most toddlers (12 to 24 months old) would be different than for most infants. Chart A ranks infants from birth to six months of age from least to greatest exposure and groups them in deciles; each of the ten bars represent about 200,000 children. For these infants, water and soil/dust are the dominant sources of exposure. However, EPA scientists note that the exposure to lead in soil/dust is likely overestimated because, lacking other data, they assumed these infants were exposed to soil and dust at rates similar to 1 year olds. From our experience, a birth- to six-month-old infant is not yet crawling on the floor or having the same hand-to-mouth practices as a 12 to 24 month-old toddler.
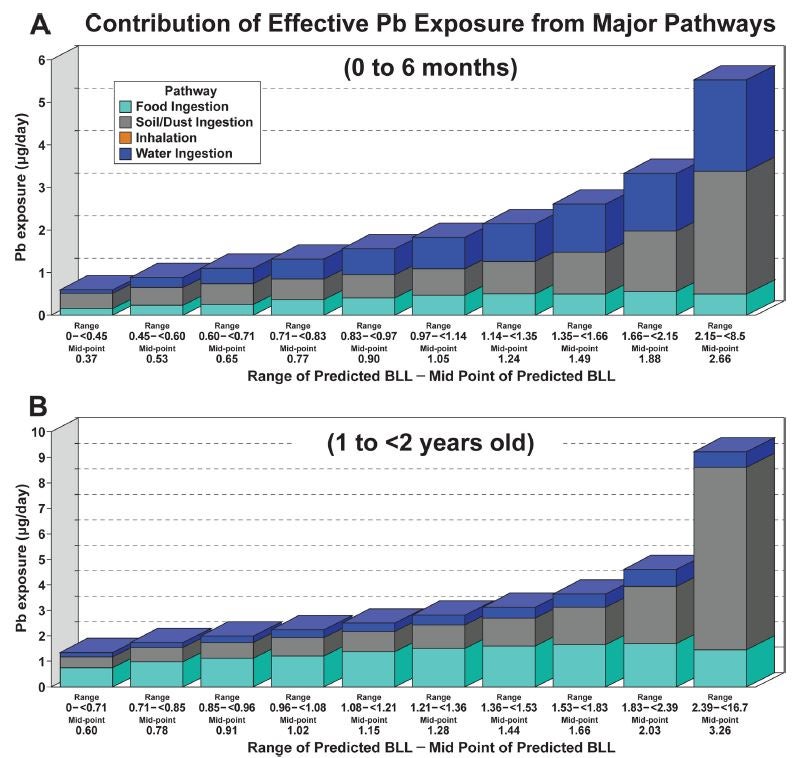
Chart B does the same with toddlers from 12 to 24 months old. Each of the ten bars represents about 400,000 children. The analysis shows that food (including beverages other than tap water) is the major source for all but the 20% of children with the greatest exposure; for the most exposed children, soil and dust dominates. However, the researchers noted that the estimate for food is based on the Food and Drug Administration’s (FDA) Total Diet Study, with many non-detectable results. They showed that their method to assign values to the non-detect levels gave a reasonable estimate.
A model is only as good as the data on which it is based, and better data may soon be available. In 2014, FDA began analyzing Total Diet Study samples for lead and other heavy metals using a more sensitive method that uses ICP-MS. With a lower limit of detection, we will know more precisely how much lead is in food. FDA has not publicly released the results using this new method. In addition, the Department of Housing and Urban Development (HUD) plans to update its 2005 American Healthy Homes Survey with more current estimates of lead in soil and dust. With EPA’s support, HUD will also include water sampling in the survey.
Continuing the progress made in preventing children’s exposure to lead takes vigilance, sound policies, and robust science. EPA’s scientists provide us with critical new insights into the relative contribution of sources of children’s exposure to lead. The insights are essential as EPA makes its long-overdue updates to its Lead-Based Paint Hazard Standards and its Lead and Copper Rule as well as its effort to update the federal government’s 1999 federal strategy to eliminate lead poisoning. When the new data from FDA and HUD are available, EPA will need to update its analysis.