Mapping lead service lines: DC Water offers a model for utilities across the nation

[pullquote]Washington, DC’s water utility launched a helpful interactive map allowing residents to see whether water pipes are lead, non-lead, or if there’s no available information for nearly every building and public water source across DC – including residences, restaurants, retailers, schools, drinking water fountains, and even the White House and Smithsonian.
[/pullquote]
Lindsay McCormick is a Research Analyst.
When I moved to Washington, DC four years ago the phrase “lead service lines” did not roll off my tongue. That began to change as I became aware of DC’s historical lead problems – and dramatically so in the wake of the crisis in Flint, Michigan.
But I’m not alone. Even though experts estimate that up to 10 million homes across the U.S. have lead service lines – lead pipes connecting the drinking water main in the street to the home – it’s an issue that is not well understood by most Americans.
And that should come as no surprise given that few water utilities across the U.S. can even say with confidence where the lead services lines are in their systems, and fewer still proactively share what information they have with customers. Lead service lines are an aging infrastructure, typically found in communities with older housing. Local recordkeeping over the years has been inconsistent, leaving many utilities today to rely on incomplete, difficult to access, or non-electronic historical records. Many communities appear to have no documentation of when they ceased installing lead service lines altogether.
When records are absent, it can be difficult to determine with certainty if a pipe is lead without digging it up – and disturbing the pipe can release lead into the water.
The situation is complicated further by ownership issues: service lines are typically split between a public (i.e., utility) side – between the main in the street and the property line – and a private side – from the sidewalk water meter to the house. As a result, utilities often have more information on the public portion of the service line.
Most utilities address the problem of lead pipes by treating the water to build a protective coating on the inside of the pipes, preventing the leaching of lead. Referred to as corrosion control, this approach is important to reduce lead exposure, but not sufficient. It leaves large potential sources of lead in the ground, putting children at risk of exposure when the protective coatings fail. Thus, the best long-term fix is to remove the lead service lines.
But how do we fix a problem when we don’t know where it is? The first step is to begin to understand what we do know and make that information available to the public – thereby raising awareness, creating demand for more information, and allowing everyone to act.
DC Water Map
Last month, Washington, DC’s water utility (“DC Water”) made important strides to increase transparency when it launched a new, interactive map. The map populates nearly every building and public water source across DC – including residences, restaurants, retailers, schools, drinking water fountains, museums, and even the White House – with a color-coded circle indicating whether the both the public and private sides of the service line is lead, non-lead, or there’s no available information. The data are based on a combination of physical inspections, consumer reports, and historical data. As such, there is variability in the reliability of each data point, which DC Water is careful to disclose.
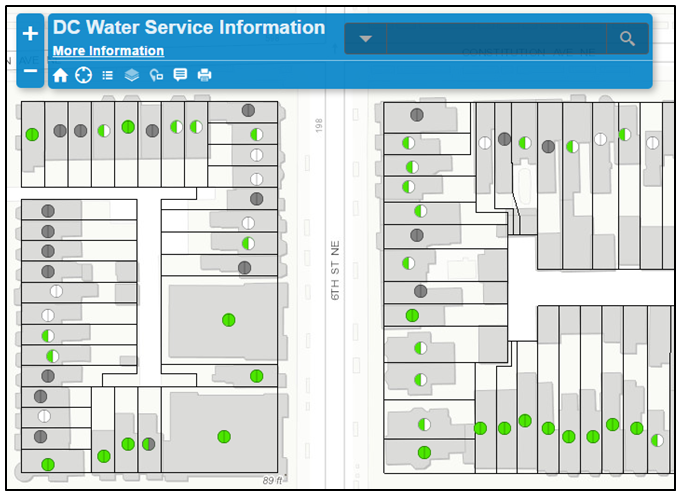
This nifty map is pretty fun to explore. Of course, the first thing I checked out was my house. The color-coded circle hovering over my narrow rowhome is a combination of white and green, signifying that while the public portion of my service line is not lead (green), there is no information for private side (white).
By clicking the circle, a pop up box provided the following additional detail on the public side: “Type: Copper; Description: Service pipe replaced 20051006.” I decided to investigative a bit further, reaching out to my landlord who confirmed that the public portion was replaced in 2005 during DC’s own “lead water crisis,” but had no additional information on the private side.
Despite the data gaps, the map allows DC residents to make their own informed decisions. Those who find a white, “no information,” circle can take steps to help understand if their home may have a lead pipe, through physical inspection or free testing provided by the city. Those with evidence of lead may pursue options to replace their lead pipes. Others may utilize temporary solutions, such as installing an NSF approved filter on their water faucet and always using cold tap water for drinking and cooking.
But it doesn’t stop there. DC residents can also check out their favorite restaurants, children’s daycare, or office building and make informed decisions to avoid lead exposure. I, for one, have started to skip a particular drinking fountain at one of my weekend hangouts after finding out that it is serviced by a lead pipe.
EPA’s call for transparency
On July 6th, EPA directed letters to state officials calling for improved public transparency and implementation of the federal rule on lead in drinking water. To that end, EPA encouraged states to make information available to the public, “The EPA believes that posting of individual sampling results is important for public transparency and intends to work with states that are not yet posting individual sample results – to share lessons learned form states that are already doing so, and to urge all states to adopt this practice.” EPA highlighted the use of online searchable databases of lead service line data as an effective method of increasing transparency. These letters come in response to resistance from many states following similar EPA letters sent to U.S. governors, state commissioners, and tribal leaders earlier this year.
We applaud DC Water for making what data they have available through this comprehensive inventory map. Access to these data is likely to both empower individuals to make informed decisions to reduce their exposure and increase their trust in the public utility. We hope that other cities and municipalities will look to DC as a model, and follow suit.