


 Throughout history, maps have played a critical role in shaping our decisions—helping us determine where we are going and how we are going to get there. Now, we’re using them to define a way to address climate change.
Environmental Defense Fund and Google Earth Outreach have worked together to launch a series of maps that show methane leaks from natural gas pipelines under city streets in Boston, Indianapolis and Staten Island. This new tool has the power to greatly improve cities’ and utilities’ ability to minimize methane emissions that contribute to global warming.
Why care about methane?
A recent tide of scientific studies about losses from the natural gas supply chain has made it clear the critical importance of reducing methane emissions (methane is the primary ingredient of natural gas).
One of natural gas’s potential benefits over other fossil fuels is that when burned it produces less carbon dioxide emissions, half as much as coal. If used wisely to rapidly displace dirty coal power plants, for example, natural gas could help the country dramatically reduce overall greenhouse gas emissions.
Unburned, however, methane is 120 times more powerful than carbon dioxide for the first 20 years after it is released. That means if too much methane escapes along the supply chain — anywhere between the well and the end user — it could postpone the climate benefits of fuel switching, a delay we can ill afford. Roughly one-third of methane emissions in the United States come from the oil and gas industry, and one third of the warming we are currently experiencing comes from anthropogenically released methane in the atmosphere, thus addressing methane leakage in the natural gas supply chain is critical.
With great data comes great responsibility
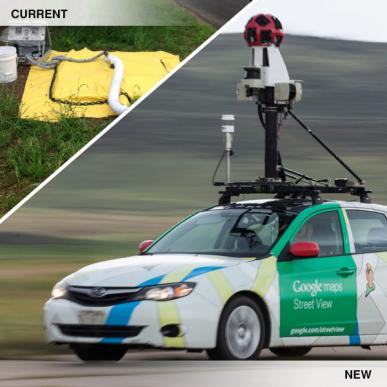
For our analysis of methane emissions from local distribution pipes, Google equipped three Street View cars with methane analyzers and drove large portions of Boston, Staten Island and Indianapolis collecting methane concentration data every half second, GPS data and wind speed and direction. Our science team, in partnership with Colorado State University researchers, developed a first-of-its-kind algorithm to translate the patterns of concentration data collected by the Street View cars into methane leak rates for individual leaks. These data and the accompanying maps are designed to help the public, utilities and regulators better understand the pattern and scale of urban methane leaks.
For example, we observed one leak per mile of road driven in Boston and Staten Island, a borough of New York City, and depending on the size of that leak the climate impact over the next 20 years ranged from the equivalent of driving a car 100 miles every single day up to driving more than 9,000 miles every day. These data will allow utilities to better prioritize which leaks to repair or pipes to replace, enabling them to get rid of the larger leaks much faster than was possible before.
Prioritizing repairs and investment
The local utilities, like National Grid (Boston, Staten Island), helped validate the data and now have added insight into where their repair efforts should be targeted. Leaks even larger than those we saw in our surveys are of the greatest public safety concern; but those leaks are usually identified and fixed quickly. Smaller leaks are monitored by the utilities, but can go unfixed for long periods of time, spewing significant amounts of climate pollutants into the atmosphere. The new methodologies developed to produce the maps hold the potential to benefit both public health and the climate.
In addition to providing a picture of leak rates across our cities, these maps clearly show the value of investing in a modern natural gas infrastructure. Older pipes made of cast iron and unprotected steel can corrode as they age, making them more vulnerable to leaks. Plastic pipes, which are used in newer systems, are more durable over time and leak much less. The 200-times-lower frequency of leaks in Indianapolis, versus Boston and Staten Island, clearly indicates the value of upgrading to plastic pipes, as was done in Indianapolis.
Investing in newer infrastructure pays off three fold:
- It minimizes safety risks;
- It benefits the climate;
- It keeps a marketable product out of the air and in the pipeline.
In the early 80s, the utility Citizens in Indianapolis made replacing their aging pipelines a priority. Today, pipes vulnerable to corrosion makes up only one percent of Indianapolis’ local distribution system, and leak rates there were congruently low. Our efforts found only five leaks in the pipelines examined – one leak for every 200 miles mapped. While Boston, where about half of the pipes are made of materials vulnerable to corrosion and have been in the ground for more than half a century, averaged roughly one leak per mile mapped.
EDF has focused on finding the ways that work for almost 50 years, and this collaborative mapping project is indicative of our commitment to tapping the power of science in pursuit of effective solutions. This project takes a major step toward providing local gas distribution utilities and regulators the scientific tools to better understand methane leaks and should spur meaningful local efforts to reduce emissions of climate pollutants. It creates more opportunities for effective action. By continuing our collaborations with Google, CSU, local utilities and the public, we can broaden the scope of what we know, map more pollutants in more cities and spark more change for climate progress.
This commentary originally appeared on our EDF Voices blog.