A revamped cost curve showcases the biggest carbon-cutting opportunities
Written By
Share
President Biden has raised the bar for U.S. climate ambition, setting targets to cut economy-wide emissions 50-52% by 2030 and achieve net-zero by 2050. As the administration, federal lawmakers and state and local leaders work to make these goals a reality with strong climate policies and investments — including in climate-focused infrastructure and reconciliation packages being negotiated in Congress — they are faced with many questions. What are the cheapest ways to cut carbon right now? How will a particular policy affect emissions? How much should we be investing in new clean technologies that are not widely available yet?
A new and improved ‘cost curve’ tool developed by EDF and Evolved Energy Research shows that the electricity and transportation sectors offer the most impactful carbon-cutting opportunities at the lowest cost right now — with potential to get us nearly halfway to net-zero emissions from energy and industry by 2050. This tool, which offers a new take on what is known as a Marginal Abatement Cost (MAC) curve, gives policymakers an economic roadmap to net-zero emissions and beyond by revealing greater insights into the costs, impact and optimal sequencing of different carbon-cutting actions.
Quick backgrounder: What is a MAC curve?
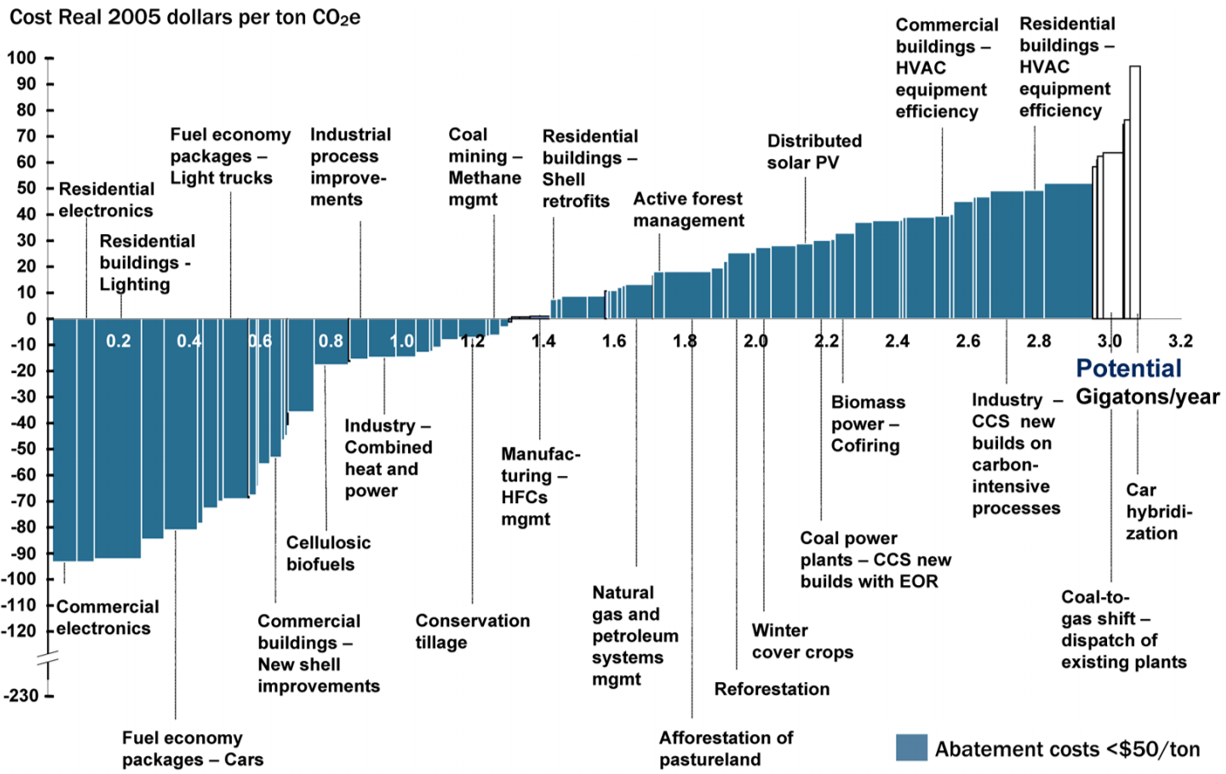
MAC curves can be useful tools to inform climate policy priorities because they highlight the relative costs and impacts of different strategies to reduce carbon pollution. However, traditional MAC curves, such as the one popularized by McKinsey & Company more than a decade ago, have noted limitations.
Traditional MAC curves typically show the total annual emissions that could be abated (or reduced) by each measure or technology (width of bars along the x-axis), ordered by the increasing marginal cost that it would take for each measure to reduce a ton of emissions (height of bars along the y-axis).
But this version doesn’t explore an increasingly important part of the story. It treats technologies as static, independent measures in a fixed marketplace. But in fact, today’s energy systems are undergoing a significant transition that is not straightforward. The most efficient sequence of deployment depends upon several other things besides static marginal cost, including how measures in the energy system can influence one another and the time required to develop different technologies and their markets.
EDF and Evolved’s MAC 2.0 curve
Recognizing this complexity, our MAC 2.0 curve offers three important improvements over traditional models:
- It captures how a carbon-cutting measure may influence other measures and other sectors. For example, the more that clean electricity resources are available, the higher the emissions reduction potential of EVs.
- It shows how the deployment levels of each technology may impact their marginal abatement cost, rather than assuming costs are constant. For example, while solar PV costs are near-zero in many areas of the country today and their deployment will achieve even greater economies of scale, it may also require supporting resources (e.g., batteries, new transmission lines) that bump up relative costs.
- It expands the array of possible measures to cut carbon. Certain measures, like electric boilers, which are used to heat homes, would be excluded from traditional MAC curves because deploying them tends to increase emissions while the grid remains largely powered by fossil fuels — even though they can decrease emissions once our electricity sector becomes decarbonized.
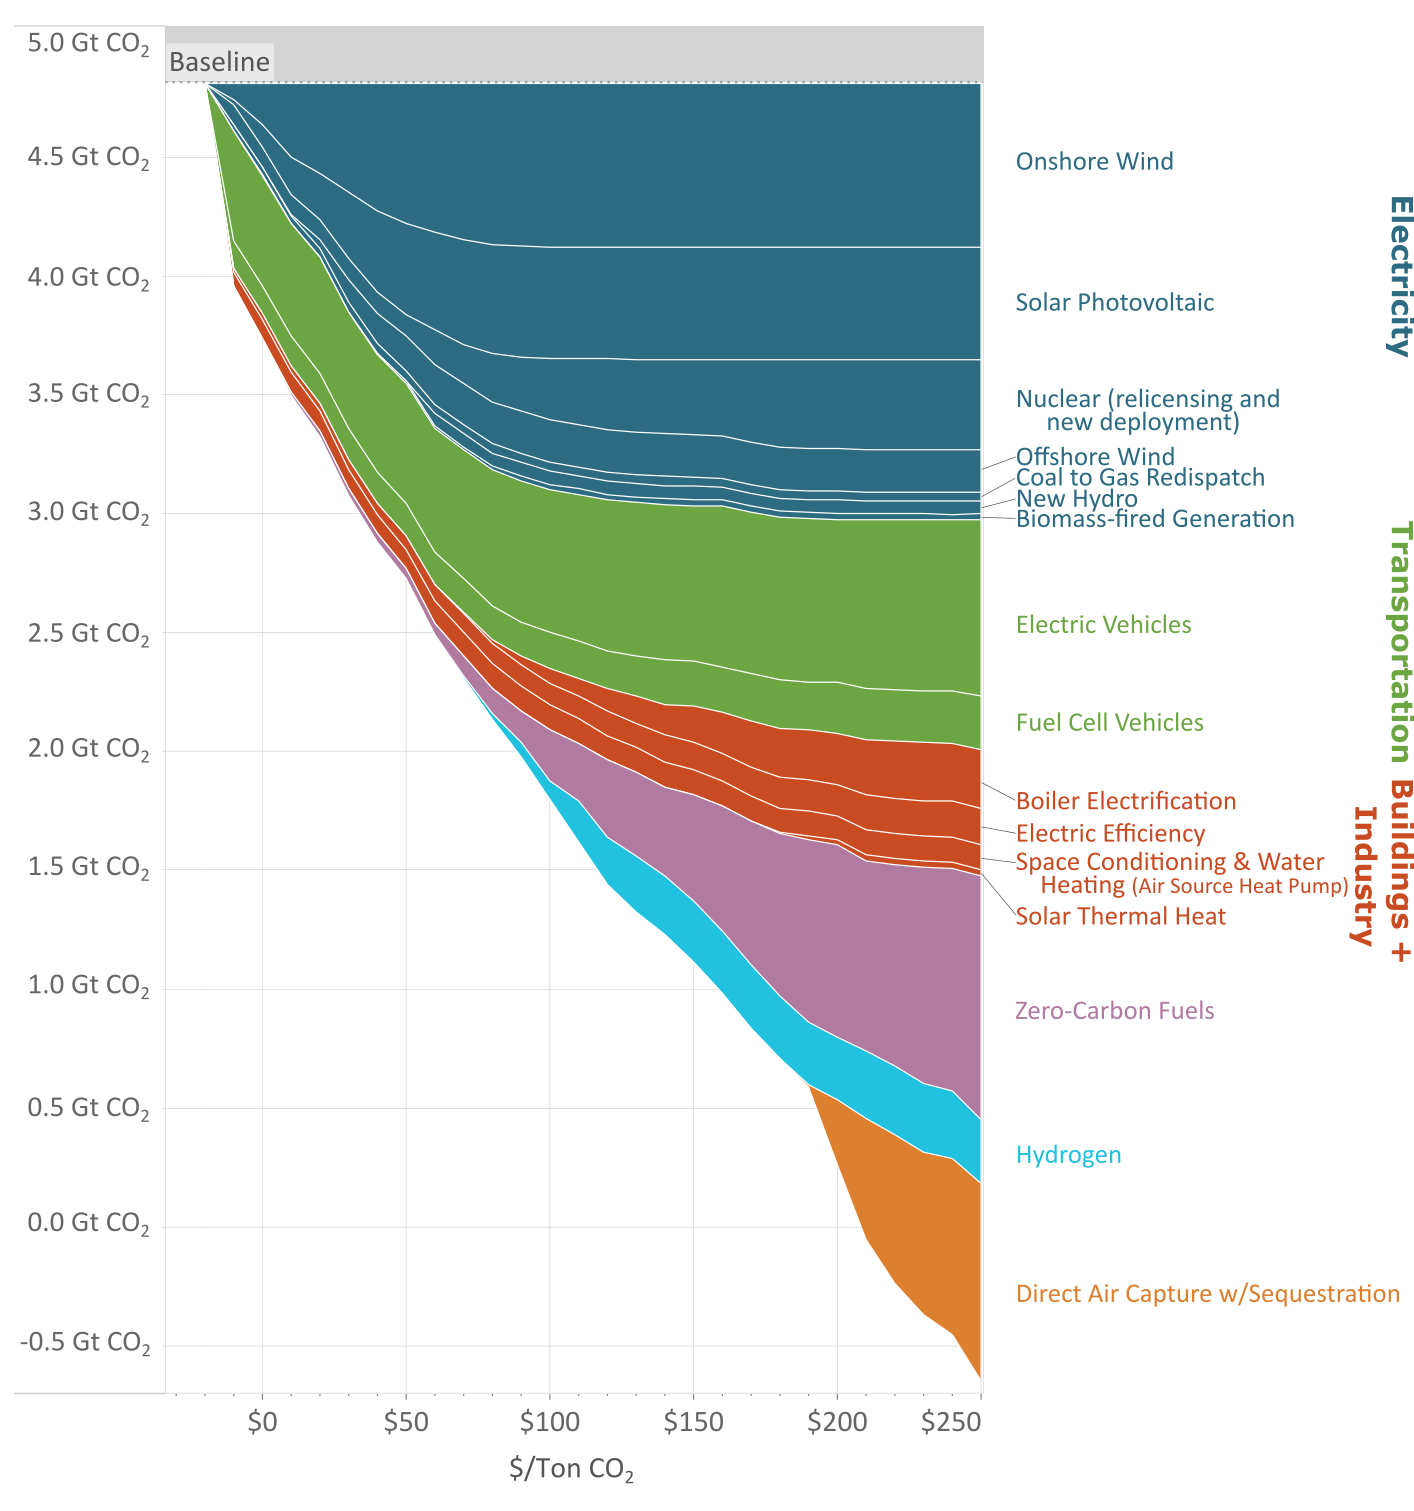
Our MAC 2.0 curve (shown below) shows the annual carbon pollution reductions from different measures across energy and industry by 2050 that become accessible at different marginal abatement costs, and it emphasizes the order of deployment that should take place to minimize overall costs.
Key takeaways
Policymakers should deploy cost-effective measures right now:
- Carbon-cutting measures in power and transportation can get us halfway to net-zero CO2 from energy and industry at little cost. Several measures — including high-quality solar PV and onshore wind, electric efficiency, nuclear relicensing, and certain EVs — are already cost-effective (i.e., MAC of $0 per ton or less). At a MAC of just $60 per ton, even more deployment of solar PV and onshore wind, along with offshore wind, becomes possible. Together, these measures could achieve more than two gigatons of annual emissions reductions by 2050 — getting us nearly 50% of the way to net-zero CO2 emissions. Securing these cost-effective cuts will require supportive policies and investments, many of which have been proposed in the reconciliation package currently being discussed in Congress. These include tax credit extensions for EV adoption and clean energy deployment, investments in public EV charging infrastructure and support for domestic manufacturing and supply chains. Crucially, these proposals could create value beyond fighting climate change by creating millions of jobs and slashing health-harming air pollution in disproportionately-impacted communities — benefits not captured in a MAC curve. For example, new programs and tax credit extensions to drive investment in new clean electricity infrastructure can create more than 600,000 jobs a year.
- Additional emissions cuts in power and transportation will require coordinated, forward-looking policies to overcome market and technological hurdles. The next opportunities on the path to net-negative emissions (i.e., those with a MAC of $60 and up) will involve policy support for medium- and heavy-duty vehicle classes and grid modernization efforts that can encourage greater renewable energy deployment.
For technologies that are not yet widely available, policymakers should support innovation efforts to bring their costs down:
- The long path to clean fuels should begin now. Hydrogen, power-to-liquids and biomass-derived fuels could save a little over one gigaton of CO2 by 2050 (20% of what we need to get to net zero) by tackling difficult sectors like shipping, long-haul aviation, and chemicals and steel manufacturing — but must overcome challenges in implementation that will require technologies that are not yet commercial or widely deployed. This means that targeted support for innovation — including applied R&D, pilot and demonstration projects, and deployment — will be critical, along with continued research into the appropriate use cases and best practices for emerging fuels.
- Direct air capture (DAC) with sequestration can help us take the final steps to net zero and even beyond — but only if we take proactive steps today. DAC is a relatively unproven technology today, and it is not a substitute for immediate and aggressive efforts to reduce climate pollution to near-zero. However, to enable DAC to scale in the 2030s and 2040s, we will need early-stage policy support to fully develop the technology, such as government procurement mechanisms, tax credits, funding for federal R&D and demonstration programs, and support for geologic carbon storage. However, DAC deployment depends on the availability and cost of zero-carbon electricity and thus relies heavily on policies to promote clean electricity in the near term.
While our MAC 2.0 curve illustrates how the U.S. goal of net-zero CO2 emissions — and beyond — from the energy system is possible, it’s important to note that it cannot answer every question about climate policy. It does not cover the agricultural, land use or forestry sectors, nor does it speak to opportunities to reduce methane emissions and other air pollutants. Moreover, this tool does not consider other important factors that should be central to decision-making, like environmental justice outcomes, equity considerations, and opportunities for more structural changes (e.g., public transportation, urban design).
However, the roadmap it provides for energy and industry CO2 emissions does show how policies and investments like those proposed in a reconciliation package would lay the foundation for generating significant progress in power and transportation, getting us nearly halfway to net zero by 2050.
It also underscores how we need to invest today in game-changing measures that can bring technologies to scale, which could make or break our net-zero goals 30 years from now. The work to translate pledges into impactful and well-coordinated policies across our economy needs to begin now.
Read the full report here.
Explore more insights from the MAC 2.0 curve here.