


 Last Thursday, the Global Carbon Project released its annual report on the state of the carbon cycle, Carbon Budget 2007 [PDF]. It emphasizes (as we reported earlier this year) that CO2 levels are continuing upward, and the rate of increase is accelerating.
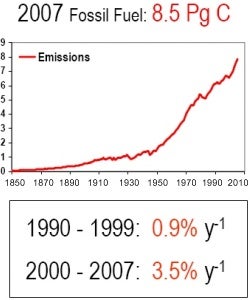
One reason for the acceleration in CO2 concentrations is higher fossil fuel emissions. Despite rising fuel prices, global CO2 emissions from fossil fuels rose 3 percent in 2007. That’s just slightly below the average increase of 3.5 percent per year since 2000.
The rate of increase for emissions lies at the upper end of the range projected by the IPCC, suggesting that we’re headed towards the most disruptive scenarios they envision. Action to stop climate change is urgent.
Check out the full report for details on what factors account for the increase. Also, the Dot Earth and Climate Progress blogs have interesting takes on the report.
This post is by James Wang, Ph.D., a climate scientist at Environmental Defense Fund.
23 Comments
James,
You say, “The rate of increase for emissions lies at the upper end of the range projected by the IPCC, suggesting that we’re headed towards the most disruptive scenarios they envision. Action to stop climate change is urgent.”
How can you possibly reach that conclusion since atmospheric temperatures have consistently fallen since 1998 (with the rate of fall accelerating the last 18 months), sea level is falling and ocean heat content is lowering?!
If anything, the data you present tends to falsify, not validate, the IPCC.
That bothers me too….the last 3 years the global temperatures have fallen a little according to GISS, NOAA. Why don’t they rise along with the CO2? I know that the temperature trend is upward, but apparently global temperatures are not in lock-stop with CO2 like Gore’s movie Inconvenient Truth insinuated with those graphs on his Powerpoint presentation. How can this be explained logically to the public? Three years in a row of lowering temperatures while CO2 rises could almost be defined as a cooling trend.
Hi- Has there been any rise in particulates?
another question, Is there a calculation for ice loss on Greenland that is measures in weight? If you know where I can see a graph of this please share that link
thank you-
Here’s what NASA’s Goddard Institute for Space Studies (GISS) has to say about the earth’s temperature:
“The eight warmest years in the GISS record have all occurred since 1998, and the 14 warmest years in the record have all occurred since 1990.”
And 2007 was tied with 1998 as the second warmest year in Earth’s history.
You can read more here:
http://www.giss.nasa.gov/research/news/20080116/
I think one thing to pull from the report Dr. Wang references, is the shift in the world’s dominant emitters. Since Kyoto came into effect in 2005, the largest percentage share of emissions has shifted from developed countries to the Annex B nations, essentially developing nations like China, Russia and India. That doesn’t mean though that the developed countries are emitting less CO2; it means that now the developing countries are emitting more CO2 than those of us in developed nations.
To me, this means emissions have to be addressed at the global level. Kyoto worked in some ways: It got the developed countries of the world to take steps to reduce their emissions. That hasn’t happened, but there has been success in reducing the growth in emissions.
In some ways it didn’t work, though. China is by most accounts the world’s largest emitter of greenhouse gases, now.
http://www.iht.com/articles/2008/06/13/business/13emit.php
This clearly indicates the need for global, coordinated action, in my opinion.
Ron
The “NASA” (actually James Hansen’s) temperatures are hopelessly compromised by bad station data. For examples, see here: http://surfacestations.org/odd_sites.htm
Because of urban heat island effects (among others) the satellite data is a better indicator:
http://wattsupwiththat.com/2008/09/08/uah-global-temperature-dips-in-august/
As you can see, temperatures continue to decline.
But, of more importance, ocean heat content (the more important measure of earth’s temperature) is falling as are sea levels.
Hi Ron,
Thanks for pointing out that there has been no long-term cooling trend since 1998. In response to mikes and kenzrw, we have a couple previous posts on the flawed claim that the climate has been cooling over the past decade, see for example http://blogs.edf.org/climate411/2008/03/24/cooling_from_la_nina/
Remember, global warming is about the long-term effects of the build-up of greenhouse gases, not year-to-year fluctuations in temperature. And the temperature has come a long way, baby.
It’s true that developing countries are now contributing the majority of annual emissions. And I agree with you that coordinated global action is needed. Actually, one of the main goals of the ongoing U.N. international climate negotiations, in which Environmental Defense Fund has been actively participating, is to get developing countries to participate more actively in emissions reductions. However, considering that developed countries have emitted most of the greenhouse gases that are currently in the atmosphere (these gases stay in the atmosphere for a long time) and have greater per capita wealth, it would only be fair for developed countries to provide technological and financial assistance to developing countries in fighting global warming.
Hi kenzrw,
Regarding Al Gore’s depiction of temperature and CO2 rising and falling in lock-step, I believe you’re referring to the fluctuations between the ice ages and warmer periods, right? If so, that’s a much longer time scale than the past three years. In the short-term, there will be fluctuations in temperature from year to year, despite a steady change in CO2. But over the multi-millennial time frame of the ice ages, as well as over the past 50 years, you can see a strong influence of CO2 on climate. (Of course, there are other long-term factors as well, such as changes in solar intensity, which complicate the temperature trends.)
Hi windsphere,
A quick response to your first comment. Different kinds of particulates can cause either cooling or warming. Sulfate particles, which come largely from coal-fired power plants and cool the climate, have held steady over the past decade as developed countries have cleaned up their particulate pollution while developing countries increase their pollution. It’s possible that there will be a worldwide decrease in sulfate pollution when developing countries also start to clean up their pollution for public health reasons. That would be great for air quality, but not so good for the climate as we lose the cooling effect.
On the other hand, black carbon emissions, the dark component of soot and smoke, absorb sunlight and warm the climate. Those emissions may be increasing worldwide as more diesel vehicles are being put on the road.
James,
Please present data (other than Hansen’s) that show the world is warming in comparison to 1998. I don’t believe you can as the UAH, RSS and HADCRU data all show cooling.
Ten years is climate, not weather. If, as the IPCC says, CO2 changes are the primary drivers of climate then temperatures should not be lower now than they were in 1998, regardless of El Nino/La Nina. This tends to falsify the IPCC’s hypothesis, especially since ocean temperatures and sea levels are both down.
Temperatures seem to be responding to the dramatic drop in solar activity over the last three years. NASA just issued this press release today: http://science.nasa.gov/headlines/y2008/30sep_blankyear.htm?list878321 .
Do humans affect the climate? Absolutely. But the IPCC’s case is fatally flawed as the current cooling (that seems to be correlated to solar conditions) demonstrates.
I don’t understand why the EDF, with all of the genuine environmental problems that exist, keeps pushing the IPCC’s case.
Mike
Mike,
It is misleading to start the temperature history in 1998, since it was an anomalously warm year due to an exceptionally strong El Nino. The trend for a short period of only ten years will be strongly influenced by any outliers in the series; for example, if you started just a year later, in 1999, the warming trend would be much larger. See the figure at the top of http://www.ncdc.noaa.gov/oa/climate/research/2007/ann/global.html . Note that I’m citing the NOAA National Climatic Data Center analysis, which is independent from the NASA (Hansen’s) analysis you are critical of but shows a similar temperature trend.
As for the supposed ocean cooling you bring up, it was due to problems with a particular set of instruments on new ocean floats. When the errors are corrected, there is no cooling trend. See a more detailed explanation at http://www.realclimate.org/index.php/archives/2007/04/ocean-cooling-not/ . There is an even more recent analysis confirming the long-term increase in ocean heat content: http://www.realclimate.org/index.php/archives/2008/06/ocean-heat-content-revisions/ . The latter also discusses uncertainties in estimates of sea-level rise, noting that recent trends from models and observations agree rather well.
Again, any fluctuations in ocean heat content that last a few years are not indicative of the long-term trend.
The UAH and RSS data sets you refer to are based on satellite measurements of temperatures high up in the atmosphere. The supposed cooling trend in these data was long ago corrected and thus claims of atmospheric cooling long ago discredited. See for example:
http://www.climatescience.gov/Library/pressreleases/pressrelease2may2006.htm
Finally, that NASA press release on solar activity you cited barely says anything about impacts on climate.
Hi windsphere,
I’m finally getting back to you on your second comment.
Regarding your question about whether there is a calculation of ice loss on Greenland in terms of weight, the answer is yes, researchers have estimated the weight loss in a couple ways. One of them involves using satellite measurements of ice flow velocity on the edges of the ice sheet, in combination with a model of snowfall in the interior, to estimate the mass budget for the ice sheet–in other words, what is the net loss of mass from the ice sheet due to changes in the discharge of ice from the ice sheet into the sea. This kind of estimate is represented by the red rectangles in Figure 3 of a paper by R. Thomas and colleagues published in Geophysical Research Letters in 2006, see http://www.agu.org/pubs/crossref/2006/2006GL026075.shtml . Unfortunately I can’t reproduce the copyrighted figure here. There might be newer studies available.
Another method is using satellites measurements of gravity fields to directly monitor changes in the mass of the ice sheet. This sort of estimate is represented by the blue rectangle in the figure.
A drawback of the gravity measurements is that they have been available only since 2002. Thus, the length of the data set is too short to determine the long-term trend in ice loss. But when the various kinds of estimates are considered together, the weight of the evidence suggests that Greenland has been losing weight over the past decade.
James,
With regard to atmospheric temperatures, the data you present stops at the end of 2007. World temperatures have fallen significantly since then.
With regard to sea temperatures, the former reference was published in 2007 (and I was not relying on the withdrawn Lyman paper in any case) and the latter does not have data up to the present time.
Finally, the satellite measurements are NOT measuring temperatures “high up” in the atmosphere.
I stand by my original comments.
Mike
Thank you for the information I kind of knew some of that but you enlightened me on a little more.
Please, can you PM me and tell me few more thoughts about this, I am actually fan of your blog…
Hello Guru, what entice you to post an article. This article was exceptionally interesting, especially since I was searching for thoughts on this subject last Saturday.
Hey very nice blog!! Man .. Attractive .. Remarkable .. I will bookmark your blog and take the feeds also…
As a Newbie, I am forever searching online for articles that can help me. Thank you
Hello. Good job. I did not expect this on a friday night. This is a cool story. Thanks!
Please, can you PM me and tell me few more thoughts about this, I am really fan of your blog…
Hey very nice blog!! Man .. Beautiful .. Astonishing .. I will bookmark your blog and take the feeds also…
I just love your weblog! Very nice post! Still you can do lots of things to improve it, and i will be back.
Ciao. Excellent job. I did not expect this on a friday night. This is a cool story. Thanks!