Major lead pipe funding shifts: What’s changed since last year
Posted: in
Chemical exposure, Drinking water, Environmental justice, Lead, Public health, Vulnerable populations
Written By

Share
Despite a 6-month delay and data gaps, EPA’s drastic reduction in lead service line counts may have unintended consequences.
What Happened?
After a 6-month long delay, EPA announced the next round of federal funding dedicated to lead service line replacement in late November. This year’s funding, totaling $3 billion, is allotted to states based on the service line inventories that were required to be submitted in October 2024.
This is the fourth year of the $15 billion funding as part of the Bipartisan Infrastructure law, dedicated to replace harmful lead pipes delivering drinking water to homes in thousands of communities.
Prior year allotments are based on EPA’s 7th Drinking Water Infrastructure Needs Survey and Assessment (DWINSA), a voluntary survey used to estimate water infrastructure needs. Now, the allotments are based on the service line inventories that utilities submitted to states as part of their requirements under the Lead and Copper Rule Revisions. This data is now driving the best current estimate of total lead pipes in the nation, which has drastically reduced from 9 million to 4 million.
How Did the Funding Change?
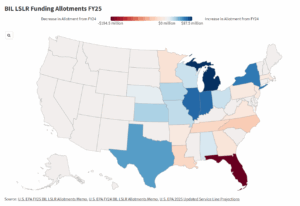
- Illinois received the greatest allotment – $309 million compared with $240 in FY24, a 29% increase.
- Michigan had the largest increase in allotted funds, receiving $87.5 million more than what they received in FY24.
- Florida had the largest decrease – from being allotted $228 million to just $34 million in FY25. (EDF has pointed out the issue with Florida receiving a large, outsized proportion of the money two years in a row and this issue has finally been resolved.)
- 32 states are receiving the minimum allotted amount of $28.6 million – 8 of those were previously receiving more than that in FY24, with North Carolina losing the most ($47.6 million).
Check out the map above to see all the changes since the FY24 allotment.
What happened to all the lead service lines?
EPA uses a formula to determine the allotments, pulling from data submitted by utilities on service line material types and projecting the number of each type in the state. They did make some questionable choices when it came to applying the data to address gaps in the service line inventories. For example:
- If a blank inventory was submitted, EPA assumed this meant the community is reporting all non-lead service lines. There is no indication that they validated this information with the community or the state directly. Almost 5,000 communities did not report anything.
- If a state did not report the number of non-lead service lines for a system but reported all other service material types, EPA estimated the number of non-lead service lines by taking the difference between their total service connections (from EPA’s SDWIS database) and reported number of service lines (from the October 2024 inventory). This could result in an inaccurate estimate by mislabeling lead service lines as non-lead. This applied to almost 6,000 communities.
While fewer lead pipes nationally would be a positive change, this drastic reduction may have unintended consequences if this new total is an underestimate, ultimately making it difficult for water utilities to plan effectively and receive needed funding for replacement.
Go Deeper: Read EPA’s memo on the funding allotments.