


Lindsay McCormick, Senior Manager, Safer Chemicals, Tom Neltner, Senior Director, Safer Chemicals and Roya Alkafaji, Manager, Healthy Communities
What Happened?
Earlier this month, EPA announced an updated formula it will use to allocate federal funds for lead service line (LSL) replacements. This new formula will be based on each state’s expected needs, as determined by a 2021 survey of state and water utility estimates.
Why It Matters
EPA’s distribution of the first of five years of the historic $15 billion dedicated to LSL replacement from the Infrastructure Improvement and Jobs Act (IIJA) was not necessarily going to states and communities that needed it most.
Many water utilities rely on the State Revolving Fund (SRF) program to build and maintain their drinking water infrastructure. EPA funds SRF programs each year and their previous formula to determine allocations was based on a 2015 survey of estimated drinking water infrastructure funding needs including LSL replacement – putting populous states like California at the top of the list. However, a 2016 article by the American Water Works Association (AWWA) showed LSLs are most heavily concentrated in the Midwest and Northeast, in states like Illinois, Ohio, Michigan, Missouri, New York, and New Jersey.
With EPA’s new formula, each state’s need, based on its estimated number of LSLs, will be used to distribute the next four years of IIJA funding for LSL replacement. This is a critical step to ensure that the system for distributing federal funds is functioning equitably and funds go to those communities with the greatest needs.
Projected Number of Lead Services Lines by State–2023
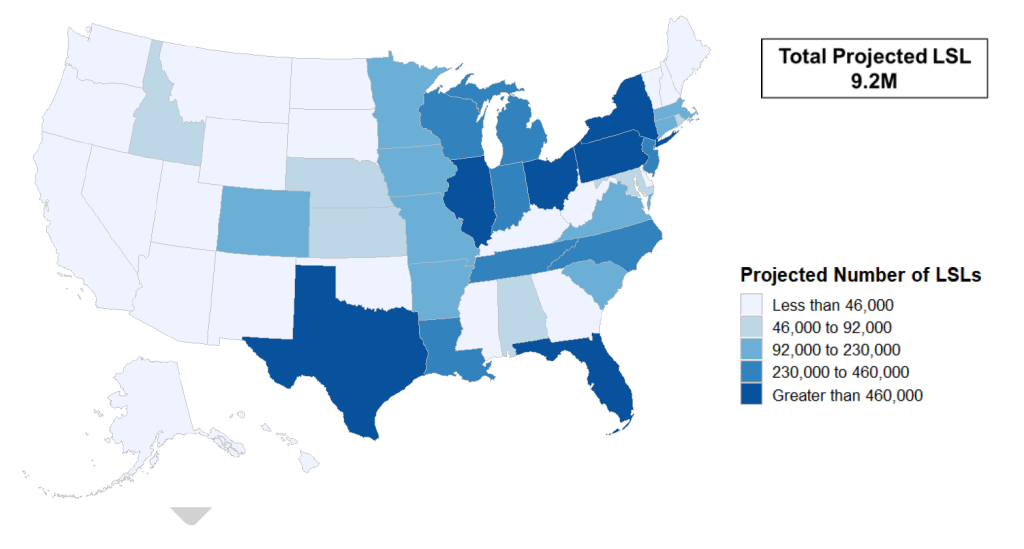
But wait…what’s going on in Florida and Texas?
When we dug into the details, there was one surprise in particular. Florida’s level of funding has increased a whopping 228%, based on a new estimate that the state has 1.2 million LSLs – more than any other state – and that about one in every six of its service lines is an LSL. Based on the age of infrastructure in the state, we think that this number is a gross overestimate. If we’re right, other states will get shorted on their share of LSL-replacement funding.
At first blush, data from Texas also caught our eye. The state reported almost 650,000 LSLs – up from 270,000 in the AWWA survey. But in contrast to Florida, this means Texas is claiming that only 5% of all its services lines are LSLs. Overall, Texas’ funding under the new formula will decrease by one-third.
What’s Next?
Starting this federal fiscal year (October 1, 2023), states will receive their new allocations of IIJA funding for LSL replacement. We’ll continue to monitor the funding flowing into each state for the critical task of getting the lead out, especially in communities that need it most. For states like Florida that may be in line for more than their fair share, we’ll be monitoring where those dollars are going.
Want to learn more?
Check out EPA’s detailed factsheet: 7th Drinking Water Infrastructure Needs Survey and Assessment