Developing effective ways to measure a community’s climate resilience
Co-authored by: Anushi Garg and Ravena Pernanand
Anushi is the senior analyst for Environmental Defense Fund’s Climate Resilient Coasts & Watersheds program in New York-New Jersey. Ravena is a research analyst at Regional Plan Association.
Across the globe, we are experiencing detrimental impacts from climate change, with low-wealth communities and communities of color hit the hardest. And while there are several ways we can measure climate impacts — such as determining sea level rise or increasing temperatures — we still lack ways to easily answer the question “how resilient are we?” Or “how does one community’s resilience compare to another?” The right tools are needed to understand how well our communities, ecosystems and infrastructure bounce back from or avoid climate impacts in order for government officials, advocates and community members to effectively assess, track and implement future solutions.
To address this gap, Environmental Defense Fund (EDF) and Regional Plan Association (RPA) collaborated on a pilot project alongside partners and stakeholders in New York City. We characterized stakeholders’ resilience priorities, such as having access to affordable and climate-safe shelter, and identified indicators that could measure the progress of these priorities.
This project lays the groundwork for developing resilience report cards that are useful to different regions, evidence-based and community informed, as well as identify specific targets that can be easily updated and support advocacy and management decision-making. Take a look at the three key findings from our project’s report:
1. We have many excellent tools to measure vulnerability and climate hazards but lack ways to measure resilience
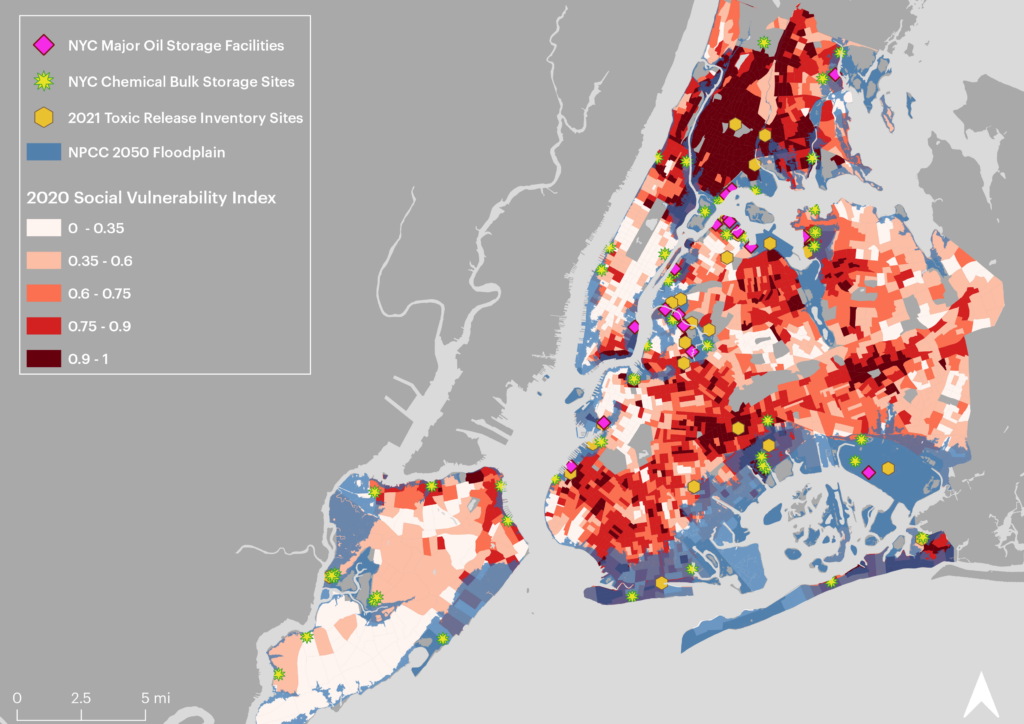
There are many indicators and mapping tools that local, state and federal officials and the nonprofit sector have developed to measure social vulnerability and exposure to natural hazards like flooding. In addition, some tools look at environmental justice, such as FEMA’s new Community Disaster Resilience Zones platform or EDF’s Climate Vulnerability Index, in addition to tools that address this on a local scale.
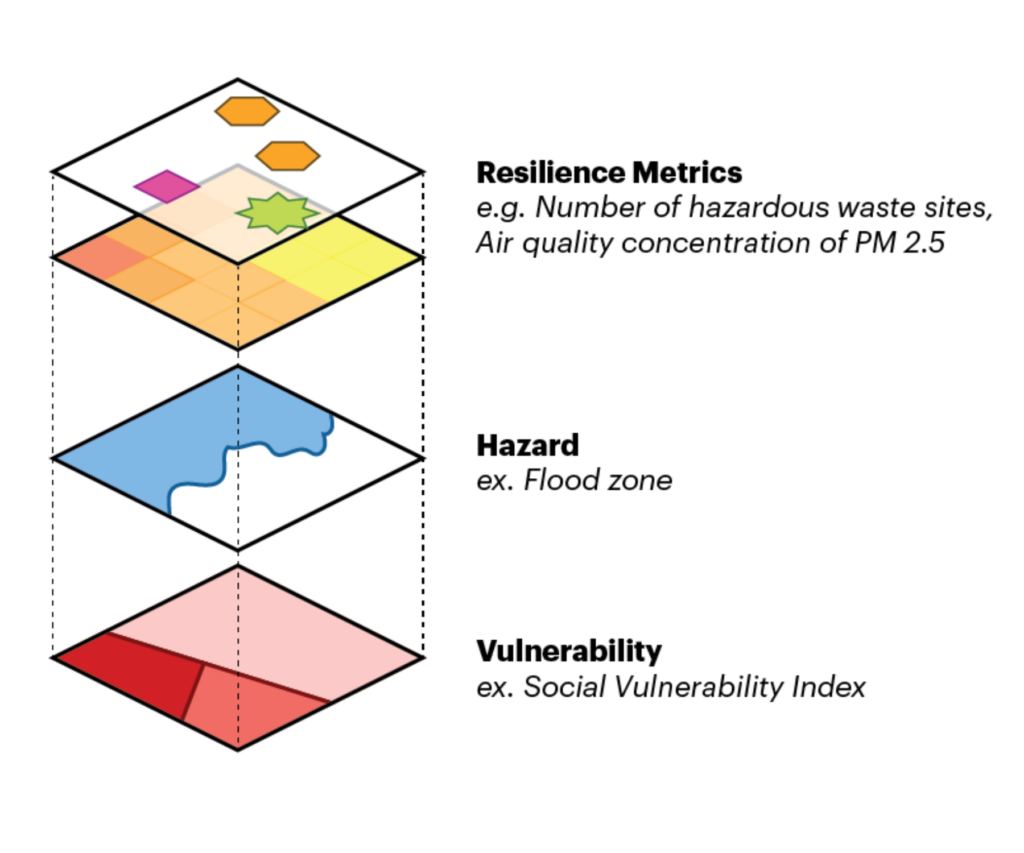
While demographic and climate hazards are important to inform resource targeting, they cannot tell us if the systems, meaning the interacting group of components that make up the core attributes of resilience, are functioning and at what level. Using these tools in combination with resilience indicators can provide greater insight into management decision making and in tracking progress.

2. Indicators should be aligned with stakeholder priorities
Following Hurricane Sandy, communities throughout New York City developed local resilience plans to ensure residents were better prepared for worsening climate impacts. For this project, EDF and RPA collected and analyzed 41 community-based plans to see if priorities were consistently articulated at the community level. Then through a series of community stakeholder workshops, we consolidated more than 500 goals and identified indicators that could be used to measure progress toward those goals.
We also reviewed an array of existing academic and gray literature and analyzed commonalities and differences in the way the communities and scientists evaluate resilience. Science typically focuses on systems, while communities overwhelmingly focus on outcomes. We used this as an opportunity to integrate science with the community’s experiential knowledge to develop indicators that can improve both existing conditions and systems.
3. We need user-friendly ways to evaluate success and shortcomings in resilience planning and management
Through the project, we identified three primary users for resilience indicators and metrics.

- Government managers, such as Chief Resilience Officers, can use indicators to evaluate the resilience of individual systems (e.g., infrastructure) and combine them with social vulnerability and hazard data to evaluate and compare across geographies and better triage funding, strategies and assistance. This allows managers to track progress, evaluate the effectiveness of strategies and facilitate collaboration across agencies toward shared goals and measurements.
- Advocates can use indicators by combining them into a simple index or resilience report card. This could help demonstrate if an area or district is underperforming compared to others, as well as build public pressure to prompt government action.
- Community-based organizations provide their communities with direct services related to resilience. A set of measurable indicators could be used to leverage financial support and guide participatory budgeting processes that foster the community’s improvement. The indicators could also educate community members about their neighborhood, help them gather community-led data and inform community-focused resilience plans.
There are several examples already of how this work might be applicable in resilience efforts. New York City’s Office of Management and Budget is currently working on developing a climate budgeting process which would track the impacts of the city’s budget on making climate improvements across all city agencies. New York has already announced a commitment to develop a comprehensive plan to build statewide climate resilience. As funding and opportunities for resilience planning and implementation become available, it is an opportune time to adopt measurable indicators as an accountability and best management practice by engaging with advocates, community-based organizations and governments and producing or co-developing user-oriented versions of this report.
We encourage partners, agencies and academia to join us in closing the resilience data gaps and use the findings from this report to prioritize resilience and improve decision making.


