Cover crop costs vary significantly: new data from 83 Minnesota farms shows
Data on the financial impacts of climate-smart practices, like cover crops, can help inform farmers’ financial decisions when considering these practices. While cover crops can help improve soil health and make farms more resilient to extreme weather, farmers continue to have questions about the types of financial impacts cover crops will have on their operations. A multi-year collaborative project is collecting and analyzing data to help farmers and their advisers answer these questions.
New financial data from 121 farms in Minnesota
In 2021, Environmental Defense Fund, the University of Minnesota’s Center for Farm Financial Management, the Minnesota State Farm Business Management program, and the University of Minnesota Extension’s Southwest Minnesota Farm Business Management Association began a collaborative effort to gather farm-level financial data on cover crops. The project is collecting detailed financial data on cover crops between 2022-2024 from corn, soybean, wheat and corn silage fields across Minnesota. Over that time, 121 Minnesota producers will contribute detailed cover crop financial data to the FINBIN database, the largest publicly available farm financial database in the U.S. In 2022, 83 farmers contributed cover crop data; 38 others planted cover crops and will contribute data in 2023.
The project aims to inform producer decisions by analyzing actual farm financial data. The data and insights from this project may also provide value to federal and local cost-share programs, agricultural lending solutions, and other climate-smart initiatives. Here is what you need to know from the first year of data:
- 2022 cover crop costs varied significantly based on their intended purpose.
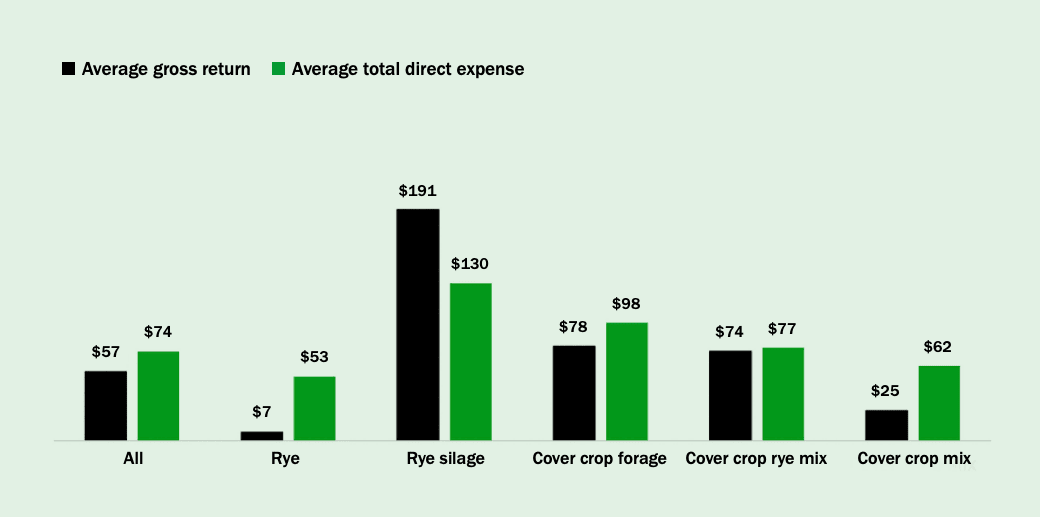
The project evaluated direct expenses for five cover crop types in 2022: rye, rye used for silage, cover crops used for forage, cover crop mixes mainly containing rye, and other cover crop mixes. While the average total direct expense for cover crops, which includes expenses like seed, fertilizer, chemicals, fuel and oil, repairs, and custom hire, was $74 per acre, the total direct expenses ranged from an average of $53 per acre for a simple rye cover crop to an average of $130 per acre for rye cover crop used for silage.
The cover crops also generated gross returns for farmers by producing livestock feed, grazing the cover crop, obtaining cost-share payments and other incentive payments. These average gross returns ranged from $7 per acre for a rye cover crop to $191 per acre for rye silage.
- Net returns of most commodity crops following cover crops were lower than the average Minnesota farm.
Throughout the three years of the project, the gross returns, total expenses and net returns for the commodity crops grown after a cover crop will be compared to the average of all Minnesota farms. The cover crop groups’ fields with and without cover crops will also be compared.
In 2022, a comparison of the cover crop groups’ fields with cover crops and their fields without cover crops showed that corn and soybeans in northern Minnesota and wheat across the state were more profitable after cover crops, while fields without cover crops were more profitable for corn and soybeans in southern Minnesota, and corn silage across the state.
In all cases except for soybeans in Southern Minnesota and corn silage across Minnesota, the yields in the cover crops group’s fields with cover crops were higher than yields in the group’s fields without cover crops. And in most cases, the total expenses of commodity crops were lower when planted after a cover crop.
When analyzing all Minnesota farms in the FINBIN database in 2022, corn, soybean, and corn silage fields with cover crops had lower net returns than fields without cover crops. The net return of corn fields with cover crops was 7% lower in southern Minnesota and 9% lower in northern Minnesota than in fields without cover crops. Soybean fields with cover crops had 50% lower returns in southern Minnesota and 5% lower returns in northern Minnesota compared to fields with cover crops. Wheat fields with cover crops, on the other hand, had net returns that were $101 (75%) higher than fields without cover crops.
What to expect next
The 2022 cover crop financial data gathered from Minnesota farmers provide preliminary insights about the financial impacts of cover crops that will be evaluated further over the next two years. The project also aims to track individual fields using cover crops over time to evaluate how those fields perform across the crop rotation.
The insights from this project will help answer questions about the types of financial impacts cover crops will have on a farm’s operation, and it can equip agricultural stakeholders, including agricultural lenders, food companies, and farm advisers, to support profitable investments in cover crops.
Join our mailing list to stay up to date on resources, news and events from EDF’s agriculture finance team: https://forms.office.com/r/rfJgG4pGjN


