Deep Dives: Environmental Health Policy

Petrochemical pollution doesn’t affect communities equally. Better regulations can help.

By Michelle Allen, Manager, Community Engagement

Recent high-profile chemical disasters in East Palestine, Ohio, and Deer Park, Texas, have highlighted the risks facing communities where the petrochemical industry operates, but not every spill or toxic pollution release makes headlines. By some counts, there is a chemical fire, explosion or release every other day in this country.

As countries around the world invest in strategies to reduce carbon pollution and rely less on fossil fuels, the oil and gas industry has turned to petrochemicals as an opportunity for growth. Petrochemicals are chemical derivatives refined from petroleum, and they’re found in products we use every day: from water bottles and plastic cases on our phones to paints, fertilizers and carpets.

But images of billowing black clouds of smoke hanging over homes, schools and parks in communities from Appalachia to the Gulf Coast are a reminder that our everyday products—many of which are for the sole purpose of convenience—are not without cost. And too often, these costs are borne by someone else.

Communities are exposed to health risks from petrochemical pollution

Exposure to petrochemical pollution—from acute events like these environmental disasters, but also from prolonged exposure to these air toxics, day in and day out—puts communities at risk. But communities don’t experience these risks equally. Black and brown communities and low-income areas bear the brunt of this unequal and unjust pollution. Children, pregnant people, seniors and people with existing medical conditions are especially at risk of developing a host of health issues from exposure to this toxic pollution, including cancer, respiratory illness, asthma and more.

Communities on the frontlines of petrochemical pollution have long expressed that they have the right to know what’s in the air they’re breathing so they can take action to protect themselves and demand accountability from decisionmakers and industry. A newly proposed update to regulations in the Clean Air Act is a significant step in the right direction.

New EPA proposal would help hold polluters accountable

The Environmental Protection Agency has proposed stronger regulations for some 200 petrochemical facilities throughout the country, more than half of which are concentrated in Texas and Louisiana. These proposed rules include safeguards against petrochemical pollution that advocates have long called for: more air-quality monitoring at the fence line of facilities, stronger protections against flaring, and actions to close loopholes that allow facilities to violate regulations during periods of startup, shutdown and malfunction.

Dedicated community leaders have been leading the fight against this pollution for decades, and it’s great to see the Administration meet these efforts with long overdue protections. We need stronger regulations at the local, state and federal levels to protect the health of residents and require regulators to hold polluters accountable to the communities where they’re operating.

The additional transparency and accountability that will come from these protections are especially critical because many of these facilities have a documented history of breaking the law: our analysis shows that more than half of the facilities expected to be impacted by this proposal are currently violating at least one environmental law, and more than 80 percent have been out of compliance in the last three years.

Strong federal protections are needed to safeguard community health

We urge EPA to adopt a strong final version of this rule that is truly protective of public health. Requiring fence line monitoring to cover a greater number of chemicals and facilities, for example, would help hold polluters accountable and prevent further harm to communities.

EPA’s proposal is a critical step in the right direction—a foundational safeguard that can ground additional layers of protection for communities impacted by petrochemical pollution. Strong federal protections should be part of a comprehensive strategy to help communities achieve a healthy, thriving future for generations to come.

Posted in Air pollution health effects, Air quality monitoring, Chemical exposures, Environmental health, Environmental justice, EPA, Fenceline communities, Petrochemicals, Policy, Science / Tagged , , , , , | Authors: / Leave a comment

Lead pipe survey flaws reveal that states may not be getting their fair share

An estimated 9.2 million homes and buildings in the nation get their drinking water through a lead pipe, according to EPA’s April 2023 report. The agency estimated the number of lead service lines (LSLs) in each state to arrive at the country’s total.[1]

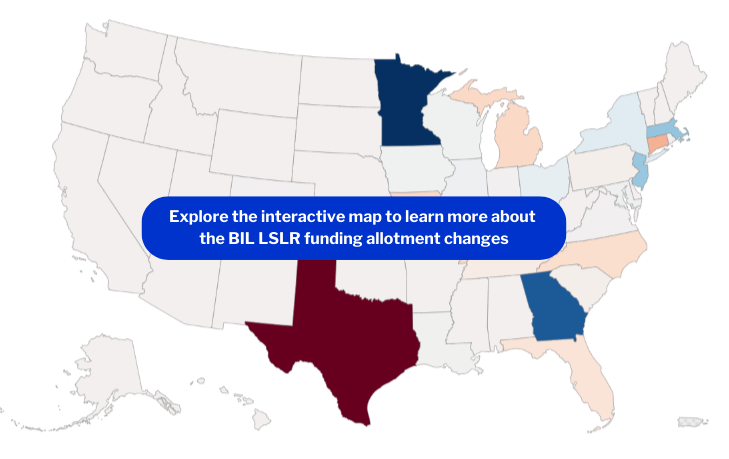
Based on these estimates, each state was allocated a share of the almost $3 billion in state revolving fund (SRF) resources dedicated to LSL replacement in the current federal fiscal year (FY23). As explained in EDF’s blog about EPA’s announcement, two states had surprisingly high numbers: Florida with 1.2 million LSLs and Texas with 650,000.

To better understand the driving force behind the estimates, we dug into a dataset containing the majority of utility and state responses to the LSL portion of the EPA survey. This data is readily available because of a Freedom of Information Act (FOIA) submission by the Natural Resources Defense Council seeking the survey responses.[2]

First impressions

With some exceptions that we’ll address in a moment, the LSL estimates reported by states and utilities were consistent with our expectations.[3] However, we also came across significant discrepancies in three key states that prompted us to investigate further.

Overall, there are three distinct problems that need untangling and warrant attention more broadly: data entry errors, conflicting state and utility information, and inconsistent directions by the state.

To its credit, EPA recognized these issues as well and plans to offer states and utilities an opportunity to revise their survey responses this fall. Those responses will then be used to allocate the remaining $9 billion dedicated to LSL replacement in FY24, FY25, and FY26. Based on what we found for Florida and Texas alone, we may have roughly 1.6 million fewer LSLs than originally estimated – good news overall.

About EPA’s survey

Every four years, EPA conducts a voluntary survey to estimate the nation’s drinking water infrastructure needs and allocate funding provided by Congress to address these needs. In 2021, EPA conducted the 7th Drinking Water Infrastructure Needs Survey & Assessment (DWINSA), which for the first time ever included information on LSLs.[4]

EPA reports that about 75% of large and medium utilities responded to the LSL portion of the survey. State agencies coordinated collection and submission of the information to the EPA. Because of the FOIA response, we have access to what EPA described as “raw, unadjusted LSL Inventory data uploaded to the [DWINSA] Website as of October 25, 2022.”[5]

As explained in the agency’s FAQs, EPA calculated the estimated number of LSLs in each state based on the sum of two components: the number of reported LSLs and the number of “undiscovered service lines [that] might be lead”.

Texas: Data entry errors

EPA’s report placed Texas and its estimated 647,640 LSLs within the top five states with the most LSLs. Based on this, the agency allocated $146 million in FY23 to assist Texas water utilities in replacing the seemingly large number of LSLs.

However, of the 116 large and medium-sized Texas utilities included in the dataset, only three reported having lead pipes in their system.[6] By far, the City of Houston led the group at 302,359 LSLs, a figure that would have earned the number two spot among all cities across the country. The other two Texas utilities – Fort Worth and Bryan – reported less than 1,000 lead pipes each.

We contacted Houston to verify their number. They promptly explained that there was a data entry error: 302,359 should have been entered as “service lines for which the material makeup of the service line and of the connector are not known”. They added that a recent reevaluation of their data would decrease the number of service lines of an unknown material to 274,098.

With this new information and our understanding of EPA’s calculation, we estimate that Texas most likely has less than 100,000 LSLs.[7] If this is correct, the state’s allocation in FY24-26 should be reduced from $146 million to the baseline of $28 million that is allocated to any state regardless of its number of LSLs. The change would free up $118 million for other states in those fiscal years.

We do not know how many other utilities may have had similar data entry errors, but all utilities should doublecheck their survey responses when EPA provides the opportunity in the fall of 2023. We expect many utilities will have improved their estimates in preparation for the October 2024 deadline to submit service line material inventories to their state under the revised Lead and Copper Rule.

Florida: Conflicting state and utility information

Florida became the state with the most LSLs when EPA estimated it to have 1,159,300 of these pipes replacing Illinois. Based on this, EPA allocated almost $255 million LSL replacement funding to Florida in FY23. Shocked by this news, we had to find out if Florida truly deserved its newfound number one spot.

Pinellas County Utilities appeared at the top of the list of Florida utilities in EPA’s dataset[8] with 40,380 LSLs. When we reached out to the utility, they told us they reported all of their service lines as “unknown” and shared a copy of the spreadsheet they submitted to the state that confirmed this. If the number of LSLs reported in EPA’s dataset for Pinellas County was accurate, that meant almost one-third of their total service lines are lead pipes, a much higher rate than cities with a long history of LSLs.

The question remained whether there was a broader trend at play with Florida’s numbers. This prompted us to reach out to the five other large utilities that reported more than 20,000 LSLs. These utilities serve Jacksonville, Fort Lauderdale, Cocoa, Hillsborough County, and Pasco County.

We heard back from all but one and the sentiment was the same – confusion as to where the numbers in EPA’s dataset came from. Some stated that they are just now starting to inventory their service lines ahead of the October 2024 deadline, and others don’t remember responding to any survey at all. We contacted Florida DEP, the agency that oversees drinking water programs, but have not heard back.

At this stage, it is still unclear as to where the numbers for individual utilities in Florida originated, but we suspect that the state provided them. As such, we estimate that there are less than 100,000 LSLs in Florida.[9] If this is correct, its allocation for LSL replacement should be reduced from $255 million to the $28 million baseline allocation.

Ultimately, what the utilities reported to the state conflicts with what showed up in EPA’s dataset. EPA and the state should work together to figure it out. Based on the lesson learned, EPA should identify states where similar problems may have occurred.

New York: Inconsistent directions

EPA estimated that New York State has 494,007 LSLs, bringing in almost $114 million for LSL replacement in FY23.

Out of the 59 medium and large utilities[10] in New York listed in EPA’s dataset, 19 reported LSLs in their distribution area.[11] We were surprised to find that New York City was listed as “no lines reported” even though their service line material data was publicly available at the time of the survey.[12]

When asked about why they didn’t report LSLs to EPA, New York City’s water utility staff responded that they were told by the state not to provide it. The state’s SRF program manager confirmed that New York City’s LSL data was not requested so New York City could focus its efforts on getting several large infrastructure projects included in the base survey, explaining that these efforts resulted in the second largest DWINSA need increase nationally. He also noted that New York City was the only public utility they did not engage with on the LSL portion of the survey.

Based on our understanding of how EPA calculated a state’s number of LSLs and how large New York City is compared to other cities in the state, we think that EPA’s estimate for New York State may be low.[13] However, in our follow-up communications with the state, we were told that EPA’s calculations includes estimates for New York City because it is based on data for other medium and large utilities in the state. The city provided a similar message. Until we see EPA’s formula in more detail, we cannot know for sure.

Nonetheless, we encourage the state and New York City to update their reporting and to provide an opportunity for other utilities to update their DWINSA responses.

Summary

We thank NRDC for submitting the FOIA request and EPA for making it publicly available. The information allowed us to look more closely at the surprises in EPA’s LSL estimates.

We also applaud EPA for its willingness to give states and utilities the opportunity to update the LSL information. We anticipate that this will enable a fairer allocation of the funding dedicated to LSL replacement to states based on their need.

We recognize that the problems found here may not be unusual for any survey seeking previously undisclosed information, especially since some of the parties did not understand that the information would affect each state’s share of the $15 billion in funding dedicated to LSL replacement.


[1] EPA’s estimate of 9.2 million LSLs includes service lines that are classified as “galvanized requiring replacement” but excludes 2.8 million standalone galvanized pipes. See page 6 of the EPA’s 7th DWINSA Fact Sheet for service line category definitions.

[2] We focused on the last file uploaded by EPA on November 7, 2022 named “EPA-2022-003617 Responsive Document Batch 6” and tab labelled “State Med-Large Data”.

[3] Based on a 2016 American Water Works Association (AWWA) Survey of LSL estimates.

[4] In 2017, Congress directed EPA to collect information on LSLs as part of the DWINSA in America’s Water Infrastructure Act (AWIA) of 2018 (P.L. 115-270).

[5] See file from FOIA response named “EPA-2022-003617 Responsive Document Batch 6” and tab labelled “Data Caveats”.

[6] EPA assigned each utility’s response (see Column E: Status) to one of four categories. Out of the 116 large and medium sized Texas utilities in the dataset, 59 utilities reported 0 lines. The remaining reported at least 1 line under the following categories: 4 all unknown, 37 no unknown, 16 some unknown.

[7] EPA’s estimate of 647,620 LSLs in Texas means that 5% of all of the service lines in the state are lead. If the number drops to less than 100,000, that translates to only 0.7% of all service lines in the state being made of lead.

[8] EPA assigned each utility’s response (see Column E: Status) to one of four categories. Out of the 85 large and medium Florida utilities in the dataset, 18 utilities reported 0 lines. The remaining reported at least 1 line under the following categories: 1 all unknown, 4 no unknown, 63 some unknown.

[9] EPA’s estimate of 1,159,300 LSLs in Florida means that 17% of all of the service lines in the state are lead. If the number drops to less than 100,000, that translates to only 1.5% of all service lines in the state being made of lead.

[10] New York State told us that 5 of the 59 utilities were removed from the state’s sample after the DWINSA data collection began.

[11] EPA assigned each utility’s response (see Column E: Status) to one of four categories. Out of the 59 large and medium-sized New York utilities in the dataset, 15 utilities reported 0 lines. The remaining reported at least 1 line under the following categories: 11 all unknown, 18 no unknown, 17 some unknown.

[12] In 2021, EDF downloaded New York City’s service line inventory from their OpenData website, showing 62,770 potential lead service lines and 126,395 service lines of unknown material. New York City told us in a June 2023 email that it reported 137,542 potential LSLs and 230,870 service lines of unknown material in 2021.

[13] EPA’s estimate of 494,007 LSLs in New York means that 14% of all of the service lines in the state are lead. If the number increases by at least 100,000 to include New York City, that translates to 17% of all service lines in the state being made of lead.

Posted in Environmental health, Lead / Tagged , , , | Authors: / Leave a comment

Broken GRAS: Secret GRAS determinations may outnumber those reviewed by FDA

What Happened?

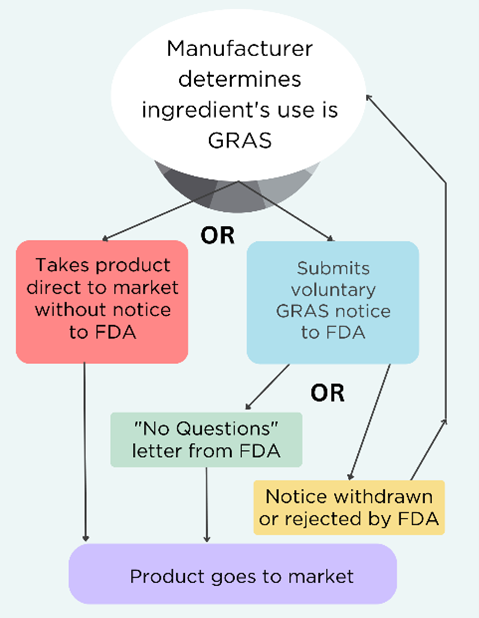
FDA estimates that, each year, food companies designate 82 new food chemicals as “GRAS” (Generally Recognized as Safe) for use in food. On average, FDA reviews only 64 of those new chemicals for safety. For the remaining 18 chemicals in FDA’s estimate, the companies making and marketing them for use in food or in the food-production process choose not to seek a voluntary review by FDA.

In comments to the agency, we said we think FDA’s estimate may be too low – and the number of new chemicals added to food that bypass FDA review may be as high as 130 new food chemicals a year (significantly higher than 18). This is based on searches of company marketing claims. In an 8-week period, we identified 10 chemicals claimed as GRAS without a submitted notice to FDA seeking voluntary review. (Please see our comments for a full explanation of our estimate.)

Why It Matters

I want to throw in chemical safety as another really, really important area for the future – for humankind, really – and where science is evolving rapidly.—Robert Califf, MD, FDA Commissioner

FDA’s review of GRAS safety determinations is critical to ensure food chemicals are safe. When agency scientists receive GRAS notices, they closely review them and ask notifiers tough questions about the safety of the chemical alone—and the potential consequences when that chemical is combined with other chemicals on the market.

But FDA allows companies to withdraw their notices – which they do in about 17% of cases. Sometimes companies fix the problems and resubmit the notice. FDA does not require companies to do this, however. Too many simply continue to market the chemical for food uses as GRAS without seeking further FDA review. That is in addition to the GRAS safety determinations companies choose never to file, which leads to chemicals entering our food system without any FDA notice or review at all.

Our Take

While the GRAS system is clearly broken (something we’ve blogged about at length and the Washington Post covered in-depth back in 2014), FDA does retain the ability and the duty to monitor the marketplace to ensure unsafe chemicals that food companies claim as GRAS are kept off the market. Unfortunately, the agency appears to lack any system to ensure that monitoring takes place. The only examples of agency action to pull industry-certified GRAS products off the market have been caffeinated alcoholic beverages and partially hydrogenated oils (aka artificial trans fat). Both were prompted, in part, by state and media calls for action.

Examples of inaction, however, are numerous and include: tara flour, COZ corn oil, Apocynun ventron, gamma aminobutyric acid (GABA), aquaequorin/Prevagen, and many more.

One of the key breakdowns that contributes to FDA’s failure to monitor is the lack of coordination between the regulatory programs in the Center for Food Safety and Applied Nutrition (CFSAN) and the inspection/enforcement programs in the Office of Regulatory Affairs (ORA).

Next Steps

In January 2023, FDA Commissioner Califf announced a proposal to reorganize the food safety program in response to stakeholder calls for action after the infant formula debacle and to a recent review of the agency by the Reagan-Udall Foundation. This review noted that one key step is to appoint a new Deputy Commissioner for Human Food. This person would have greater responsibility to coordinate efforts between CFSAN and ORA. The Commissioner’s proposal has been strongly criticized since there would be no clear line of authority between the new Deputy Commissioner and ORA.

But Commissioner Califf has stated that chemical safety is a priority, telling a reporter that “I want to throw in chemical safety as another really, really important area for the future – for humankind, really – and where science is evolving rapidly.”[1]

Fixing GRAS is an important step to rebuild consumer confidence and reduce the ongoing risk to public health. Until the broken GRAS system is fixed, FDA will continue to be hamstrung in preventing health risks posed by chemicals of unknown safety. Until the system is fully fixed—which includes ensuring that no chemicals enter our food system without notice to, and review by, the agency—FDA needs to be coordinating with ORA and CFSAN to proactively monitor and enforce GRAS evaluations on chemicals entering the market to ensure they are actually safe.

Go deeper: You can learn more from these resources:


NOTES

[1] FoodFix, January 31, 2023, edition.

Posted in Environmental health / Authors: , / Leave a comment

Alternative Figures: FDA’s food chemical reports to Congress don’t add up

In its annual justification of budget estimates to Congress, FDA describes its activities and tracks its performance. One of those performance measures is the percentage of food- and color-additive petitions (FAPs/CAPs) the agency has reviewed and completed within 360 days of receipt.[1]

We analyzed FDA’s reports to Congress published from 2016 to 2023 and found that FDA told Congress it had completed 100% of its reviews within 360 days in every year but one. The exception was FY2020, when the rate dropped to 89%. During that 7-year period, the agency reported that it had filed a total of 51 petitions. (See Table 1.)

Why It Matters

FDA’s impressive claims about the percentage of FAP/CAP reviews it completed run contrary to our experience and the available evidence:

  • FDA’s own webpage describes seven petitions that have been under review for over 360 days. (See Table 2.) Five of those overdue petitions were filed in FY2021, when the agency claimed it had reviewed and completed 89% of them. The agency reports filing and reviewing only two petitions in that year.
  • Four of five petitions submitted by food safety advocates for which the agency has made a decision were in FDA’s review pipeline for over 360 days.[2] For three of those overdue petitions, FDA acted only after petitioners sued in court for unreasonable delay. (See Table 3.)
  • FDA’s guidance for industry on these petitions says, “the average time between submission until a final rule is published for a direct food additive petition is 24 months and for color additive petitions, the approval process varies significantly.”

Our Take

Accurate and transparent reporting empowers Congress to:

  • See that the agency is having difficulty meeting its deadline for reviewing FAPs/CAPs; and
  • Set priorities and evaluate FDA’s funding requests more effectively.

Our Research Findings

Table 1 summarizes those findings. We excluded years where we did not have data for both petitions filed/reviewed in the fiscal year and the percent of petitions reviewed within 360 days.[3]

Table 1: FDA’s Reporting of Office of Food Additive Safety Activity

(Year of Budget Justification Reports)

Fiscal Year FAPs/CAPs

Filed/ Reviewed*

FAPs/CAPs Percent Reviewed within 360 days
FY2015

10 / 11
(2016 report, p. 61)

100%

(2017 report p. 57 &

2016 report p. 59)

FY2016 7 / 7

(2017 report, p. 60)

100%

(2018 report p. 54 &

2017 report p. 57)

FY2017 10 / 10

(2018 report p. 57)

100%

(2019 report p. 67 &

2018 report p. 54)

FY2018 10 / 10

(2018 report p. 57)

100%

(2021 report p. 80 &

2020 report p. 68 &

2019 report p. 67)

FY2019 5 / 5

(2021 report p. 82 &

2020 report p. 70)

100%

(2022 report p. 96 &

2021 report p. 80 &

2020 report p. 67)

FY2020

7 / 7

(2021 report p. 82)

89%

(2023 report p. 66)

FY2021


2 / 2

(2022 report p. 98)

100%

(2023 report p. 64 &

2022 report p. 96)

* Reviewed includes approved, withdrawn, or placed in abeyance due to deficiencies during the fiscal year.


Table 2 identifies all food and color additive petitions that FDA’s website reported as under review (and not in abeyance or decided) as of April 7, 2023. “Days Under Review” is calculated as of that date.

Table 2: Status of Food and Color Additive Petitions
Under Review as of April 7, 2023

Substance and Requested Action Petition No. Filing Date Days Under Review
Revoke BHA FAP 0A4216 6/22/90 11,977
Allow jagua (genipin-glycine) blue CAP 0C0317 7/31/20 980
Allow Vitamin D3 FAP 1A4827 2/3/21 793
Allow Gardenia Blue Powder CAP 1C0319 4/20/21 717
Allow vitamin D2 mushroom powder FAP 1A4828 6/8/21 668
Allow blue Galdieria (Galdieria sulphuraria) extract CAP 1C0320 7/27/21 619
Allow vitamin D2 heat-killed (“inactive”) baker’s yeast FAP 1A4829 9/28/21 556
Allow myoglobin CAP 2C0322 12/13/21 480
Revoke bisphenol A (BPA) FAP 2B4831 5/2/22 340
Revoke Red Dye No. 3 CAP 3C0323 11/15/22 143


Table 3 reviews the timing of FAPs/CAPs submitted by food safety advocates since 2014. Where available, FDA’s decision on the petition is noted, as well as whether petitioners went to court asking a judge to issue a writ of mandamus to order the agency to act. For each of those lawsuits, FDA agreed relatively quickly to a schedule to make a final decision on the petition.

Table 3: Timing of Review for Advocates’ Petitions
Seeking Revocation of Food and Color Additive Approvals
(as of April 7, 2023)

Substance and Requested Action Filing Date Decision Date Days Under Review Decision Lawsuit Filing Date
Perchlorate as FCS 12/31/14 4/28/17 849 Denied 3/31/16
Long-chain PFAS (non-sulfonated) as a food contact substance (FCS) 1/7/15 12/29/15 356 Accepted None
Carcinogenic flavors as food ingredient 8/17/15* 10/2/18 963 Accepted for 6 of 7 5/17/18
Ortho-phthalates as FCS 4/12/16** 5/20/22 1516 Denied 2/7/21
Lead acetate as cosmetic color additive 2/24/17 10/25/18 618 Accepted None
Bisphenol A as FCS 5/2/22 Pending
Red Dye No. 3 11/15/22 Pending
* Revised to 2/12/16 due to substantive amendments provided by petitioner.

** Revised to 3/26/18 due to substantive amendments provided by petitioner.


Next Steps

The agency should explain to Congress and stakeholders how it came up with its numbers and ensure accurate and transparent reporting.

NOTES

[1] The statutory deadline for a final decision on a food or color additive petition is 90 days, with an option to extend for an additional 90 days for a total of 180 days. See 21 U.S.C. §§ 348(c)(2) and 379e(d)(1). We do not know why FDA’s performance measure gives the agency twice as much time to complete a review than is allowed by the law.

[2] Long-chain PFAS food additive petition was processed in 356 days. See Table 3.

[3] FDA reported 100% for FY2014 in the 2016 report(p. 59) but did not include the number of FAPs/CAPs reviewed. In its 2023 report, the agency reported reviewing five FAPs/CAPs (p. 61) but did not provide the percentage of reviews that had been approved, withdrawn, or placed in abeyance in 360 days.

Posted in FDA / Authors: / Leave a comment

Health data needs to inform targeted environmental justice initiatives

Key Findings and Recommendations 

  • Air pollution results in a large burden of childhood asthma across the country, and this burden is disproportionately borne by people of color.
  • More than $100 million in grants from the Environmental Protection Agency is available for environmental justice initiatives, but targeting programs to alleviate the health impacts of air pollution to overburdened communities requires local-level health information that is often not readily available.  
  • We recommend health advocates and researchers work with local and state public health departments and impacted communities to access existing fine-scale data where available.

In the past, the lack of neighborhood-scale data on baseline disease rates, pollutant concentrations and children’s asthma has made it difficult to determine which U.S. communities bear the highest health burden from air pollution. Disparities in pollution exposures have been routinely underestimated. Generating more fine-scale data, together with advances in hyperlocal air monitoring, will make visible the disparities in exposure to air pollution across and within neighborhoods, allowing us to target mitigation and prevention efforts for maximum benefit. 

We now have an opportunity to make significant progress towards identifying, prioritizing and addressing the harms faced by the most burdened communities. EPA has made available over $100 million dollars for grants to advance environmental justice, including health impact assessments. Grant recipients can use the funds to obtain health information at the neighborhood level, data essential for identifying communities with the highest burden of air pollution health impacts. The application deadline is April 14, 2023. 

Pollution and racism 

Using new air monitoring techniques, advances in modeling, and community-based participatory research, studies confirm that neighborhoods which have experienced historical racism also experience higher levels of air pollution.

Decades of discriminatory and racist policies, practices and disenfranchisement have resulted in the disproportionate exposure to pollution sources in communities of color, along with disinvestment in housing and economic opportunities in these communities. Communities of color and areas of low wealth therefore face exposure to higher levels of air pollution and are more vulnerable to that air pollution, resulting in heavier health burdens borne by families.  

Air pollution data is only half of the story 

While air pollutant exposure is important in determining the effect of that pollutant on the health of a community, social factors and existing disease burden and risk play a large role in the impact that pollutant will have on the total health burden attributable to a pollutant in a community.  

Existing disease burdens and risks in populations are reflected in “baseline disease rates,” a key public health metric documented by public health agencies. Baseline disease rates vary within cities, but those rates are rarely made publicly available for use in risk assessment. 

Gaps in baseline disease data availability limit the ability of health impact assessments to determine which communities have existing vulnerabilities to the harmful effects of air pollution. For example, while studies of pediatric asthma attributable to nitrogen dioxide, a traffic-related air pollutant, have estimated there are 200,000 affected children living in American cities, these studies have relied on national-level estimates of asthma incidence. These national-level estimates hinder the ability of researchers to determine which areas within cities are experiencing the highest burden of asthma attributable to asthma. 

Local-level health data is needed to identify risks to overburdened communities  

The public health information available from city to city and within cities is a mix of fine-scale data (ZIP code level) and coarse-scale data (ZIP3 – aggregated data based on ZIP code information, roughly the size of counties.) The assessment of health risks, factors and outcomes can vary greatly depending on which level of data is used. 

Studies have repeatedly shown that using fine-scale baseline disease rates can make a profound difference when mapping the spatial distribution of health burdens attributable to air pollutants and on the ability to quantify disproportionate impacts in disadvantaged populations. For example, in an analysis of within-city air pollution risks in the San Francisco Bay Area of California, we found the highest census block group baseline mortality rate was 12 times higher than the rates in the census block group with the lowest rates, while the highest county rate was only four times greater than the lowest county mortality rate.

Lack of fine scale data leads to unreliable analysis 

Our work in New Jersey highlights the pitfalls of using only coarsely-resolved spatial data in identifying those communities that are at highest risk of the health burdens of air pollution. An analysis of the impact of pollution in that state found that 18,000 asthma emergency room visits by children could be attributed to fine particle pollution and 70% of those impacts were among communities of color (Asian, Black and Native American) and Hispanic populations.

Comparing the results using coarse-scale and fine-scale data, we found that:

  • Analysis using coarse-resolution emergency room visit information overestimated the burden to white populations. It underestimated the burden to people of color by as much as 90%
  • Using fine-scale data, we found emergency room visits for the ZIP code with the highest burden to be 1.5 times higher than the highest burden estimated using coarse-resolution data. 
  • We also found that using fine-scale data revealed double the variation between the ZIP code with the highest risk of PM-attributable visits and ZIP codes with the least risk of PM-attributable visits. Variation allows us to observe the relative disparities in risk within a community that are not otherwise observable with coarse-scale baseline disease data. 

The use of coarse-resolution (ZIP3) asthma emergency department visit data may underestimate PM-attributable asthma burdens (number of cases per 10,000) among non-white populations when compared to fine-scale (ZIP) data. Red shows communities where coarse-resolution health data underestimates risks.

Local-level health information can help EPA and other funders to identify and direct resources to the communities that need it most, which are too often communities of color facing legacy injustices. 

Our work in the Bay Area of California highlights the need for fine-resolution data on baseline disease rates, as pollutant concentrations alone were unable to capture the variation of air pollution health risks within Oakland.  

The maps shown in Figure 2 are of the neighborhoods of West Oakland. Looking only at the spatial distribution of the highest pollutant concentrations (A), the area of highest risk appears to be the truck traffic corridor of I-880. However, when we incorporated census block group baseline disease rates (B), provided by the Alameda County Public Health Department, we found that the area of highest risk, and therefore where the largest emission reductions could result in the largest reduction in health burden, was another area of West Oakland where both baseline mortality rates and pollution levels were elevated.  

Pollutant concentrations and county baseline disease rates alone would not have revealed this vulnerable neighborhood. A better understanding of pollution hotspots can help direct federal funds intended to address long legacies of pollution burdens to communities where they’re most needed. 

West and Downtown Oakland. The map on the left (A) shows the spatial distribution of pollutant concentrations, with high concentrations highlighted in the blue circle near major roadways. The map on the right (B) shows the spatial distribution of air pollutant attributable health burdens when the spatial distribution of underlying disease patterns are taken into consideration. The area of highest air pollutant attributable health burdens in map (B) is highlighted in the blue circle.

Ways to expand and improve local-level health data 

Past investment in satellite-derived estimates and local air pollution monitoring has resulted in making exposure disparities visible. Similar investment is required now for developing fine-scale data on baseline disease rates, which will enable identification of communities with the highest air pollution-attributable health burdens.  

Mechanisms currently exist for developing more fine-resolution data on baseline asthma emergency department visits. As part of the analysis in New Jersey described above, we purchased discharge-level emergency department visit data for New Jersey from 2016 to 2019 from the Healthcare Cost and Utilization Project’s State Emergency Department Database (HCUP SEDD). We urge the Agency for Healthcare Research and Quality, which manages the HCUP SEDD, to develop baseline asthma emergency department visit datasets and that the Agency update these datasets annually and make them publicly available. 

We recommend that health advocates and researchers work with local and state public health departments to access existing fine-scale data where available. We have found that local health departments often have the data needed but lack the resources to dedicate staff and expertise to process and analyze the information. As an example, EDF has had success working with the Alameda County Public Health Department to develop mortality rates at the census block group level. Other impediments to developing baseline disease rates include lack of funding and concerns about privacy. 

Deadlines approaching for funding opportunities to develop local-level health data 

EPA is accepting environmental justice grant applications through April 14, 2023 through two avenues: the EJ Collaborative Problem-Solving Cooperative Agreement Program (EJCPS) and the Environmental Justice Government-to-Government (EJG2G) program. 

While both grant programs are relevant to the use of local-level health data, the Government-to-Government grants allow community-based organizations to partner with their local health department on use of local-level data in health impact assessments. This can help alleviate the problem discussed above regarding inadequate staffing and expertise at local health departments.  

Of the five broad categories listed in the funding announcement, use of local-level health data fits under the category “community-led air and other pollution monitoring, prevention, and remediation, and investments in low- and zero-emission and resilient technologies and related infrastructure and workforce development that help reduce greenhouse gas emissions and other air pollutants.” 

Posted in Air pollution health effects, Air quality monitoring, Environmental health, EPA, Risk evaluation, Science / Authors: , / Leave a comment

TSCA And The East Palestine Ohio Train Derailment Are Related–Here’s How

By Maria Doa, PhD, Senior Director, Chemicals Policy, and Lauren Ellis, MPH, Research Analyst

SUMMARY: We explore the connection between the Toxic Substances Control Act (TSCA), the risks of toxic chemicals from transportation accidents, and the pathway to better protect communities.

Last month, a Norfolk Southern freight train hauling several railcars carrying toxic chemicals derailed in East Palestine, Ohio. The crisis not only put several surrounding communities at risk of chemical pollution and negative health outcomes, but also highlighted the ongoing concerns faced by environmental justice communities that live with chemical pollution every day. There are significant gaps in the ways that the risks of chemical exposure are evaluated.

The Ohio train derailment is just the latest example of how accidents involving highly toxic chemicals can have harmful impacts—both short- and long-term—on communities’ health and welfare. By expanding evaluations to include the risks of chemicals at all stages of the chemical lifecycle, EPA can better protect communities.

Train hauling tanker cars full of chemicals

Immediate Impacts

The train derailment has put members of the community in East Palestine at significant risk for a range of health problems and is impacting their livelihoods and welfare. When the train derailed, it released vinyl chloride (known to cause cancer in humans) and other toxic chemicals into the surrounding air, water, and soil. Vinyl chloride is used to make plastic polyvinyl chloride (PVC), which is used in a wide range of products, including plumbing pipes and shower curtains.

Following the derailment, more than 115,000 gallons of vinyl chloride were burned. Burning vinyl chloride produces hydrogen chloride and phosgene, extremely toxic and corrosive chemicals.

In the aftermath of the derailment, residents have reported experiencing a variety of immediate health problems, including new reports of chemical-induced bronchitis. Because of the potential health risks, people are living in hotels miles away from their homes, families, and friends; in some cases, they have pulled their children out of school.

In addition, local waterways were blocked off, private wells were shut tight, and residents report that they still smell chemical residue in the air. Since the incident, more than 43,000 fish, crustaceans, and amphibians are known to have died.

And these are just the immediate effects. It may be years until we have a better understanding of the long-term impacts of exposure to these toxic chemicals.

Strengthening TSCA Reviews Could Better Protect Communities Like East Palestine

TSCA requires EPA to assess available information on the hazards and exposures of chemicals throughout their lifecycles; this includes a requirement that EPA specifically consider a chemical’s domestic production, import, processing, distribution in commerce, use, and disposal. “Distribution in commerce” includes transporting chemicals.

TSCA also requires EPA to consider the duration, intensity, frequency, and number of exposures when assessing the risk of a chemical. But so far, EPA has yet to fully embrace the tools in the reformed chemical safety law when it comes to assessing the risks toxic chemicals pose during transportation.

EPA does not assess the risks from the distribution in commerce of toxic chemicals in its risk evaluations because it considers current hazardous materials transportation regulations as sufficient to prevent chemical exposures. Thus, EPA did not quantify exposures and risks from spills, leaks, and other releases from transportation incidents but concluded there is “no unreasonable risk” from distribution in commerce of the first 10 chemicals assessed under reformed TSCA.

In our recent comments on the revised risk determinations for the first 10 chemical to undergo risk evaluation under reformed TSCA, we questioned EPA’s conclusion that distribution in commerce does not present an unreasonable risk. We suggested an approach that is more reflective of the risks that communities face.

In response, EPA stated that exposures from the distribution of chemicals in commerce would be minimal “given the fact that these chemicals are transported according to existing hazardous materials transportation rules.”  EPA did not share their reasoning of how transportation incidents involving the first 10 chemicals—including at least 28 incidents involving methylene chloride and six incidents involving TCE in 2022 alone—result in minimal risks to communities, nor how existing transportation regulations mitigate those risks.

We Can Do More to Protect Communities

People can be—and are—exposed to toxic chemicals at all stages of the chemical lifecycle, from spills, leaks, and other transportation incidents to chemical facility releases. The exclusion of these types of releases and exposures underestimates the risks faced by communities located near the site of these preventable accidental releases of toxic chemicals.

This needs to change.

To accurately assess chemical risk under TSCA, EPA should consider data on spills, leaks, and releases from derailments, collisions, and other transportation incidents in its risk evaluations. These releases and exposures simply cannot be ignored.

Posted in Air pollution health effects, Chemical exposures, Environmental health, EPA, Policy, Risk evaluation, Safer chemicals, Science, TSCA / Authors: , / Leave a comment

Unleading Baby Food: FDA, USDA, and industry need to invest in research to reduce lead in baby food

Tom Neltner, Senior Director, Safer Chemicals Initiative

Note: This is the third of three blogs in this series. Click here for Blog 1 or Blog 2.

On January 24, 2023, FDA released draft action levels for lead in foods intended for babies and young toddlers.1 For most of these foods, the limit would be 10 parts per billion (ppb). FDA proposed a less-protective limit of 20 ppb for dry infant cereals and single-ingredient root vegetable products (i.e., carrots or sweet potatoes) because these products may have greater lead contamination levels. This proposal is a key step in implementing the agency’s Closer to Zero Action Plan.

In this blog, we take a deeper dive into the research needed for FDA to fulfill its commitment to continuously improve its action levels. We identify four issues for which FDA, USDA, and industry should support research if we are to make progress in reducing toxic element contamination of food:

Bags of riceSweet potatoes

QuinoaCarrots

Rice is highly contaminated with lead, as well as with high levels of inorganic arsenic. Rice has long-been recognized as the primary source of young children’s dietary exposure to inorganic arsenic. FDA’s data2 now make clear that lead contamination is also a significant issue. For the 299 rice cereal samples, the 90thpercentile was 21 ppb of lead, and 28% had levels of 10 ppb or more. In contrast, only 1 of 85 samples (1.2%) for non-rice or multigrain cereals had 10 ppb or more of lead, and the 90th percentile was 8 ppb, so a 10-ppb level can be met and is justified.

In 2020, FDA highlighted that inorganic arsenic concentrations for infant rice cereal had dropped from 64% greater than 100 ppb in 2011-13 to 53% in 2014 to 26% in 2018. Some of this progress can be attributed to baby food companies screening out rice with higher levels, a change that shifts the more highly contaminated products to general market. However, there is also compelling research showing that improved growing and processing methods such as intermittent flooding of fields, removing bran, and decanting cooking water significantly reduce inorganic arsenic contamination.

More research is needed to reduce lead contamination in rice and how it correlates to inorganic arsenic levels). We also need additional research on essential nutrients in rice.

Sweet potatoes commonly have significant lead contamination, but research shows promise. Lead contamination of sweet potatoes was significant enough that FDA set an action level for foods where they were the only ingredient. FDA’s three data sources evaluated 14 samples of sweet potato puree and half of the samples were above 15 ppb with the highest at 34 ppb.

Several years ago, EDF funded Dr. Arthur Villordon at Louisiana State University’s Sweet Potato Research Center to investigate the lead contamination and identify potential research opportunities. He and his team determined that much of the contamination was in the peel, suggesting that optimized peeling would be beneficial. They also identified the possible role of type of sweet potato—as well as opportunities to manage essential nutrient availability—to reduce uptake of lead.

Along with researchers from Mississippi State University, University of California—Davis, Colorado State University, and two units of USDA’s Agricultural Research Service, Dr. Villordon and his team applied to USDA last month for significant research support to evaluate those and other opportunities.

Quinoa is highly contaminated with lead and cadmium. Arsenic levels were not provided. The levels of lead in quinoa were significantly higher than rice cereal, grain snacks, or root vegetables. While the data set is older (from 2014) and much smaller (29 samples), the 90th percentile was an astounding 90 ppb of lead. In addition, 41% had 20 ppb or more of lead and 58% were over 10 ppb.3 In addition, cadmium was also present in all but two of the samples ≥ 10 ppb and 75% were ≥ 50 ppb.

EDF talked with one of the leading researchers on quinoa, Dr. Lori Hoagland of Purdue University, about opportunities to reduce contamination. She thought that changing strains of quinoa might be the best strategy, although research funds are limited.

Carrots also have significant lead contamination. As with sweet potatoes, FDA data showed that carrots were also contaminated with lead, although at lower levels than sweet potatoes—the other root vegetable common in baby food. For the 39 samples of carrot puree, the 90th percentile was 15 ppb of lead, and 20% had levels of 10 ppb or more.

Several years ago, EDF funded Dr. Hoagland to investigate lead contamination in carrots and identify potential research opportunities. She and her team determined that much of the contamination was in the outer areas of the carrots, suggesting that optimized peeling would be beneficial. They also found that a particular strain of carrot showed promise in reducing uptake of lead and cadmium.

Along with researchers from Michigan State University, Cornell University, University of Buffalo, University of California—Davis, and a unit of USDA’s Agricultural Research Service, Dr. Hoagland and her team applied to USDA last month for significant research support to determine more effective ways of reducing lead in carrots.

Additive or Synergistic Impacts of Lead, Cadmium, Arsenic, and Mercury
FDA’s Closer to Zero Action Plan focuses on four toxic elements—lead, cadmium, inorganic arsenic, and mercury. One of the early goals was to consider the cumulative effects of these toxic elements on children’s developing brains.

Dr. Piper Reid Hunt and a team at FDA’s Office of Applied Research and Safety Assessment have been studying the harm to the developing nervous systems of nematodes (C elegans) because they are similar enough to human neural development to allow helpful insights. Her important research is not yet made public.

In summary, we encourage FDA, USDA, and industry to invest in research to reduce contamination of foods with toxic elements and evaluate the research that the presence of these substances in the diet can have on children.

Sign up to receive notifications when we publish a new Deep Dives post!

1 We included all 29 samples that FDA identify as quinoa, even if the agency did not also identify it as a dry cereal.

2 1) Toxic Element Program consisting of 356 samples of dry infant cereals, fruits, mixtures and vegetables collected from 2008-2021; 2) FDA Survey 1 consisting of 147 samples of dry infant cereals and mixtures collected from 2013 to 2014; and FDA Survey 2 consisting of 360 samples of fruits, mixtures, vegetables, yogurts, custards/puddings, and single-ingredient meats collected in 2021.

3 FDA’s guidance refers to babies and young children. However, the action levels only apply to foods intended for children younger than 24 months, a very narrow definition of young children, especially since children up to six years of age are particularly vulnerable to the harm to their brain from lead. Other federal agencies set standards for this broader age range. Toddlers are generally considered to be between 1 and 3 years of age. Therefore, we use the term “toddlers” to avoid confusion.

Posted in Babies, Environmental health, FDA, Food safety, Lead, Policy, Science, Toddlers, Young children / Authors: / Leave a comment

Unleading Baby Food: FDA needs to improve how it sets action levels to be more transparent and credible

Tom Neltner, Senior Director, Safer Chemicals Initiative

Note: This is the second of three blogs in this series. Click here for Blog 1 or Blog 3.

On January 24, FDA released draft action levels for lead in foods intended for babies and young toddlers.1 For most of these foods, the  limit would be 10 parts per billion (ppb). FDA proposed a less-protective limit of 20 ppb for dry infant cereals and single-ingredient root vegetable products (i.e., carrots or sweet potatoes) because these products may have greater lead contamination levels. This proposal is a key step in implementing the agency’s Closer to Zero Action Plan.

Overall, FDA fixed several problems we highlighted in our Unleaded Juice series about the agency’s draft action levels for lead in juice, which it released in April 2022. However, significant issues remain, especially regarding the agency’s transparency, that undermine the credibility—and ultimately the effectiveness—of the action levels.

We discuss the proposed action levels and recommendations for more protective limits as well as specific research needs in separate blogs. Here, we take a deeper dive into FDA’s approach to setting these action levels.

Action Levels v. Regulatory Standards
FDA’s regulation at 21 C.F.R. § 109.6 addresses unavoidable contaminants in foods. It says FDA should use action levels when “technological or other changes that might affect the appropriateness of the tolerance are foreseeable in the near future.” If the agency does not foresee changes that would reduce the contamination, the regulation indicates it should set tolerances through rulemaking. By issuing action levels, FDA is affirming its commitment to continuous improvement —a key element in its Closer to Zero Action Plan.

In general, FDA develops action levels through guidance rather than rulemaking because it claims that the process enables the agency to move more quickly and to make updates more easily. Guidance has typically been subject   to less stringent interagency review by the White House’s Office of Management and Budget (OMB).2

Nonetheless, FDA’s action levels for lead and inorganic arsenic in food have undergone OMB review, and that review has been quite lengthy.3 The delays have been significant enough that FDA revised its Closer to Zero Action Plan in January by:

  • Changing its commitment to publish draft action levels for lead and arsenic to only submitting the document for interagency review. These documents are not public until finalized.
  • Eliminating its commitments to finalize all of its draft action levels.
  • Dropping the word “Action” from the title of the program.

Lack of Transparency in Decision-Making Undermines Credibility and Effectiveness
We do not suggest that action levels need to undergo the full regulatory interagency review by OMB. However, there are elements of that review that would improve the transparency and credibility of the decision, as well as the effectiveness of the action levels. They might also accelerate OMB review. Therefore, we recommend:

Explaining the options the agency considered and why it selected the action level described in the guidance.
FDA’s current approach only compares the selected option to the status quo. We know many of the excellent FDA staff working on the issue and how seriously they approach this effort. They surely considered many variations before settling on the proposed option. However, that information is largely omitted from the proposed guidance and supporting materials. This omission makes it more difficult to provide constructive comments to the agency and undermines the credibility of the decision.

Estimating dietary exposures that protect more than just the 90th percentile of children. FDA typically uses the 90th percentile to evaluate exposure to contaminants or additives. We have not seen a rationale for selecting this value over more protective ones—like the 95th percentile commonly used in Europe for food or, in the U.S., using the 97.5th percentile to set an elevated blood lead level (CDC) or the 99th percentile for pesticides in the U.S.

As we explained in a blog on the lead-in-juice proposal, while percentiles may seem abstract, we think it is important to recognize that, in this case, they represent lead-exposed children. Using the 90th percentile means that the 2.4 million children ages 1 to 6 years who are exposed to higher levels of lead are not taken into account.4 When including children younger than age 1, the number is even greater.

Calculating the socioeconomic benefits of the options considered and the one selected. As we explained in a blog on the lead-in-juice proposal, we encourage FDA to use methods developed by EPA (and accepted by OMB) to quantify the societal benefits of reducing young children’s exposure to lead. We applied that method to estimate that a 6% reduction in exposure for children younger than six years of age would yield $1 billion per year in benefits.We think this approach is a valuable tool to help the agency and stakeholders consider options. It would also prompt industry to provide realistic estimates of the cost to achieve the limits, rather than the vague claims it often relies on.

Transparently comparing the options considered to their impact on FDA’s Interim Reference Level (IRL) of 2.2 µg/day for children. In 2018, FDA established an IRL of 3.5 µg/day. The agency describes this value as the “maximum daily intake for lead from food” of lead for children. This is not a health-based level—rather it is a target the agency uses to drive lead contamination lower through its 2021 Closer to Zero Action Plan. Using FDA’s own analysis, we estimated that more than 2 million young children (aged 1-6 years) exceeded the IRL.

In July 2022, FDA lowered the IRL to 2.2 µg/day to conform to changes in CDC’s Blood Lead Reference Level. We estimated that 7 million young children (one-third of all children in this age group) exceeded this level and called on FDA to more rigorously compare its proposal—including options considered—to the IRL. We also asked the agency to estimate the number of children who would no longer exceed the IRL as a result of each option.In the draft guidance document, FDA states that under the status quo “the 90th percentile dietary exposures for babies and young children are below the IRL for lead of 2.2 μg/day for children.” While the agency shows that 90th percentile intake of specific groupings of foods are below the IRL, the agency provides no details for how it reached that conclusion, which should apply to dietary intake from all sources and not just those covered by the action levels.5

In other words, the approach would exclude the contribution from food not covered by the action levels, such as: 1) juices; 2) grain snacks (e.g., teething biscuits, cookies, and puffs); 3) fruits, cereals, and vegetables that parents use to make homemade foods for their babies and young toddlers, even though these products are often likely to be more contaminated, regardless of whether they are organic; and 4) foods marketed for a general audience such as applesauce and canned food, that parents (especially those on tight budgets) commonly feed to children.

In addition, the Agency’s assertion contradicts that of an FDA scientist who estimated in 2019 that children 12 to 36 months had a 90th percentile lead intake of 2.6 μg/day from their diet.6 It is unclear if this is due to differences in methodology, or a true decrease in exposure between then and now.

Assuming the claim is true and that the 90th percentile is at 2.2 μg/day, it still means that 10% of the approximately four million children born each year— or about 400,000 children – exceed the IRL. This illustrates the flaw in choosing the 90th percentile to represent an “upper bound” and “a health protective measure to account for babies and young children (0-23 months) who consume larger amounts of food and would therefore have higher exposures.”

As we have previously commented, FDA’s choice of the 90th percentile is out of step with other agencies, including CDC and EPA. The agency should not only be transparent about its calculations, but it should be clear how many children will be brought below the IRL with each option considered in order to provide critical context for the strengths and weaknesses of the agency’s analysis.

Posting all toxic element testing results—not just lead—for the data supporting the guidance. When FDA evaluates a sample for lead, the lab method also provides results for cadmium, arsenic, and mercury. This is important since FDA’s Closer to Zero Action Plan is focused on the health risks to young children from lead, cadmium, mercury, and inorganic arsenic and highlights the cumulative risks from these toxic elements.

Unfortunately, FDA only provides the results for lead when it posts the supporting data for both its draft action levels for lead in juice and lead in food intended for babies and young toddlers. The agency provides no explanation for why it withholds data for the other contaminants.We raised this concern in our comments on the draft action levels for lead in juice. FDA failed to address its lack of transparency despite the opportunity and minimal burden.

Posting a red-lined version of the document that compares the original version submitted to OMB for review and the final version. Agencies, including EPA and FDA, post a comparison that shows the changes made to its rule and accompanying justification as a result of the OMB review. FDA does not do that for OMB review of guidance. The comparison helps stakeholders understand the key issues, and it poses little burden to either agency. FDA should post the red-lined version.

In summary, FDA needs improve the process by which it proposes and finalizes action levels by improving its transparency. This will make the agency’s decisions more credible—an important consideration for ensuring industry compliance with the guidance.

Up Next: Unleading Baby Food: FDA, USDA, and industry need to invest in research to reduce lead in baby food

Sign up to receive notifications when we publish a new Deep Dives post!

NOTES

1 FDA’s guidance refers to babies and young children. However, the action levels only apply to foods intended for children younger than 24 months, a very narrow definition of young children, especially since children up to six years of age are particularly vulnerable to the harm to their brain from lead. Other federal agencies set standards for this broader age range. Toddlers are generally considered to be between 1 and 3 years of age. Therefore, we use the term “toddlers” to avoid confusion.

2 Specifically, OMB’s Office of Information and Regulatory Affairs (OIRA).

3 For example: 1) Lead in food intended for babies and young toddlers where proposed guidance was under OMB review for 9 months; 2) Lead in juice where proposed guidance was under OMB review for 13 months; 3) Inorganic arsenic in infant rice cereal where final guidance was under OMB review for 4 months; and 4) Inorganic arsenic in apple juice where final guidance has been under OMB review for 21 months and counting.

4 Approximately 4 million children are born each year in the United States. Over a six-year period, that would mean ~24 million children in the age range.

5 The three values in the sixth column of Table 4 add up to 2.02 μg/day but that is not a valid method for 90th percentiles.

6 Based on the hybrid estimate from the report. Note that the lower bound is 1.8 and upper bound 4.4 μg/day.

Posted in Babies, Environmental health, FDA, Food safety, Lead, Policy, Science, Toddlers, Young children / Authors: / Leave a comment

Unleading Baby Food: FDA needs to tighten its proposed action levels

Tom Neltner, Senior Director, Safer Chemicals Initiative

Note: This is the first of three blogs in this series. Click here for Blog 2 or Blog 3.

On January 24, 2023, FDA released draft action levels1 for lead in foods intended for babies and young toddlers.2 This proposal is a key step in implementing the agency’s Closer to Zero Action Plan.

For most of these foods, the lead limit would be 10 parts per billion (ppb). FDA proposed a 20-ppb limit for dry infant cereals and single-ingredient root vegetable products (i.e., carrots and sweet potatoes), because these products may have greater lead contamination levels.

The action levels do not apply to five types of foods that young children frequently eat:

  • Grain-based snacks such as teething biscuits, sandwich cookies, and puffs—despite FDA’s finding that the biscuits and cookies were two of the three foods with the highest mean lead concentrations that the agency tested for its Total Diet Study from 2018-2020.
  • Fruits, cereals, and vegetables that parents use to make homemade foods for their babies and young toddlers—despite those products being likely to be more contaminated, whether or not it was labelled as organic.
  • Food marketed for a general audience (e.g., raisins, applesauce, canned food) that parents commonly feed to children —especially families on tight budgets.
  • Food marketed to young children over age 2, including kids’ meals and some snack bars.
  • Juices, since FDA proposed limits on those in April 2022 and should finalize them this year.

FDA has not set—or even proposed—action levels for lead for any of these foods (except juice). Based on the current Closer to Zero Action Plan schedule, the agency has no plans to establish action levels for the foods listed in items 2 and 3, above.

Do Food Companies Have to Comply with Action Levels?
The short answer is technically and legally “No”—but in practice, “Yes”…with important caveats. As with all guidance, FDA makes clear that:

[G]uidance documents do not establish legally enforceable responsibilities. Instead, guidances describe FDA’s current thinking on a topic and should be viewed only as recommendations, unless specific regulatory or statutory requirements are cited. The use of the word should in FDA guidances means that something is suggested or recommended, but not required.

As a practical matter, action levels serve as limits that companies meet to decrease the risk of having FDA deem their products adulterated and subject to a recall. In addition, FDA expects food facilities to use their Hazard Analysis and Preventive Control Program to achieve action levels by managing their facilities and suppliers to ensure compliance and taking action if problems are revealed through testing or other efforts.

FDA’s Criteria for Setting Action Levels
There is no safe level of lead in the diet. Lead can enter the food chain through multiple sources, including crops grown in contaminated soil and/or irrigated with contaminated water, atmospheric deposition from industrial activities, and old food-processing equipment that contains lead. The objective is to get exposure closer to zero.

In its proposed guidance, FDA said:

[W]hen evaluating possible action levels under 21 CFR 109.6 for lead in foods intended for babies and young children less than two years old, we took into account several considerations, including:

  • the action level should minimize the likelihood that a consumer will be exposed to lead levels exceeding the IRL (interim reference level);
  • as appropriate, there should be a limited number of unique action levels for simplicity;
  • the action levels should result in a reduction in exposure to lead; and
  • for those baby foods where lead levels are already relatively low, the action levels should be established where achievability is in the 90th-95th percentile range.

EDF’s Recommendations for Making FDA’s Proposed Action Levels More Protective
We did a deeper dive into FDA’s proposal and the three datasets3 it published to support its decision. We applied FDA’s achievability target of 90th percentile to develop four recommendations to improve the action-level proposal and reduce dietary exposure to lead for babies and young toddlers, even though we think FDA should use a stricter target for infants and babies—as it did for inorganic arsenic in infant rice cereal.4 For the sake of simplicity, we also sought to minimize the number of unique action levels:

  1. The 20-ppb action level for dry infant cereals should be limited to rice cereals; other grains should have a 10-ppb action level. For the 299 rice cereal samples, the 90th percentile was 21 ppb of lead, and 28% had levels of 10 ppb or more. By contrast, only 1 of 85 samples (1.2%) for non-rice or multigrain cereals had 10 ppb or more of lead, and the 90th percentile was 8 ppb—so a 10-ppb level can be met and is justified. Note that rice cereal is also high in inorganic arsenic.
  2. Beyond dry infant cereals, foods that contain no root vegetables as ingredients should have an action level of 5 ppb instead of 10 ppb. For 478 samples without root vegetables5, the 90th percentile was 3.3 ppb of lead, while 6% had 5 ppb or more. Note that half of those over 5 ppb had quinoa as an ingredient. Based on these results, foods other than dry cereals that do not have root vegetables should have an action level of 5 ppb. For 110 samples of food with root vegetables as one of multiple ingredients, the 90th percentile was 11 ppb of lead and 22% had 5 ppb or more. For foods whose only ingredient is a root vegetable, a 20-ppb action level is justified.
  3. Grain snacks, such as teething biscuits, puffs, snack bars, and cookies should have an action level of 20 ppb; they are some of the most contaminated baby foods. For 123 samples of these foods collected in 2013-14, the 90th percentile was 18 ppb of lead and 26% had 5 ppb or more. While the samples are old, there are sufficient samples of these popular products with high enough levels that the agency should set a level of 20 ppb.
  4. Quinoa, an increasingly popular ingredient for baby food, requires greater scrutiny, starting with increased sampling, since almost half of the samples with quinoa as the sole or main ingredient have lead levels of 20 ppb or more. The levels of lead in quinoa were worse than rice cereal, grain snacks, or root vegetables. While the data set is older (from 2014) and much smaller (29 samples), the 90th percentile was an astounding 90 ppb of lead. In addition, 41% had 20 ppb or more of lead and 58% were over 10 ppb.6 Without more data, FDA should maintain a limit of 20 ppb for dry cereal and 10 ppb if that cereal is combined with other ingredients.

We made these recommendations in our formal comments on the proposal that we submitted on March 27, 2023 . In subsequent blogs, we identify significant problems with the process FDA uses to establish action levels for lead and to describe specific research needs. (Updated on 3/28/23 to reflect submission of our comments to FDA and link to the document.)

Up Next: Unleading Baby Food: FDA needs to improve how it sets action levels to be more transparent and credible

Sign up to receive notifications when we publish a new Deep Dives post!

NOTES

1 FDA’s guidance refers to babies and young children. However, the action levels only apply to foods intended for children younger than 24 months, a very narrow definition of young children, especially since children up to six years of age are particularly vulnerable to the harm to their brain from lead. Other federal agencies set standards for this broader age range. Toddlers are generally considered to be between 1 and 3 years of age. Therefore, we use the term “toddlers” to avoid confusion.

2 Action levels represent levels at which FDA may regard food as adulterated and seek a recall.

3 In its 2018 sample results, 29% of the 149 samples exceeded 100 ppb of inorganic arsenic in infant rice cereal.

4 1) Toxic Element Program consisting of 356 samples of dry infant cereals, fruits, mixtures and vegetables collected from 2008-2021; 2) FDA Survey 1 consisting of 147 samples of dry infant cereals and mixtures collected from 2013 to 2014; and FDA Survey 2 consisting of 360 samples of fruits, mixtures, vegetables, yogurts, custards/puddings, and single-ingredient meats collected in 2021.

5 Excluding dry infant cereals.

6 We included all 29 samples that FDA identified as quinoa, even if the agency did not also identify them as  dry cereal.

Posted in Babies, Environmental health, FDA, Food safety, Lead, Policy, Science, Toddlers, Young children / Authors: / Leave a comment

Introducing Deep Dives—EDF’s New Platform for In-Depth Scientific & Policy Analyses on Environmental Health

Deep Dives is a new blog that will offer our readers in-depth scientific analyses, hard data, and practical policy prescriptions from Environmental Defense Fund’s (EDF) top environmental health experts. Our authors are specialists in air quality, chemistry, epidemiology, law, public health, and more.

We will continue to offer information for broader audiences on EDF’s Safer Chemicals and Global Clean Air blogs, which will also announce the publication of all new Deep Dives posts and provide summaries and links to them. We encourage you to subscribe to and read these existing blogs, since we will continue to publish shorter (but no less important!) articles on those channels.

But we’re starting this new platform to provide “deep dive” information to policy makers and implementers, scientists, academics, and advocates who understand the importance of detailed subject-matter knowledge and who value proven expertise in environmental health and policy.

We know that’s a rare group because data show that only about 5% of web visitors read all the way to the end of any internet content, no matter its length. Content with nuance—and numbers—can feel anachronistic in the daily tsunami of digital information we are expected to consume.

But if you’re reading this, you are probably already in that 5%. You know that some information is worth the time and effort it takes to read and absorb it, and you want content that is deep, rich, and backed by both data and informed opinion.

We created Deep Dives for you.

Through cutting-edge research, wide-ranging partnerships, and a focus on strengthening laws and policies that protect health, we’re making air, water, food, and household products safer. Here, our experts will show you how by giving you the solid science and actionable policy recommendations you’ve come to expect from EDF.

We’ll make the time you spend on this blog worth the effort and ensure that you leave with new information and/or a new perspective worth considering. That’s a promise.

Now let’s dive in…..together.

Two scuba divers in silhouette

Sign up to receive notifications when we publish a new Deep Dives post!
Posted in Environmental health, Policy, Science / Authors: / Leave a comment