Is California becoming Uninsurable?
This blog was authored by and Carolyn Kousky, Associate Vice President for Economics and Policy, EDF.
As wildfires burn across L.A., thousands of residents are about to face the heart-breaking, confusing, stressful, and difficult process of rebuilding after disaster. This recovery process can be incredibly costly, and the majority of Americans do not have sufficient resources to fund the recovery on their own. After losing their home, many are not in a position to take on additional debt, and federal disaster aid is often insufficient – indeed, it was never designed to make people whole after a disaster.
Unsurprisingly, then, our own research confirms that households with insurance tend to have better recoveries. In a recent paper, we document that households with insurance are less likely to report high financial burdens in both the short and long term, and they are less likely to have unmet funding needs. We also find in our work that when more households have insurance, it has positive spillovers for local economies, with visitations to local businesses increasing.
These important financial benefits are at risk when households cannot find or afford insurance. Since the devastating wildfires of 2017 and 2018–the state’s most damaging until the recent blazes–the California insurance market has been under stress, putting more residents in that position. In response, the state has recently adopted regulatory reforms that are important steps toward improving the California insurance market. But with the ever-increasing risk of climate disasters, can insurability be preserved?
We summarize the dynamics in the California insurance market that have been unfolding through six sets of graphs, providing context for the current insurance issues facing the state as recovery begins.
[Note: For the rest of the post, we categorize all California ZIP codes based on their wildfire hazards into five groups: very low, low, moderate, high, and very high wildfire hazard(1). We will then discuss how insurance conditions vary based on exposure to these different levels of wildfire risk.]
Recent California insurance market dynamics in six graphs
- Insurance market stress in California began following the 2017 and 2018 wildfire seasons–the most damaging in the state’s history until the recent conflagrations.
California has long been affected by wildfires; however, as these events become more frequent and intense, they are increasingly threatening the profitability of the insurance industry. As illustrated in Figure 1, the two consecutive wildfire seasons in 2017 and 2018 wiped out more than twice the total underwriting profits that California homeowners insurers had accumulated in the previous 32 years (since 1984), leaving them with an aggregate underwriting loss of over $10 billion. Among all private insurers that wrote at least 0.1% of the market share by direct premiums earned in the homeowners insurance line of business between 2017 and 2018, approximately 85 percent (with a total market share of 92%) reported underwriting losses(2).
Figure 1: California Homeowners Insurance Underwriting Profits, 1984-2022

- As profitability declined, insurers reduced the amount they were willing to insure in areas prone to wildfires.
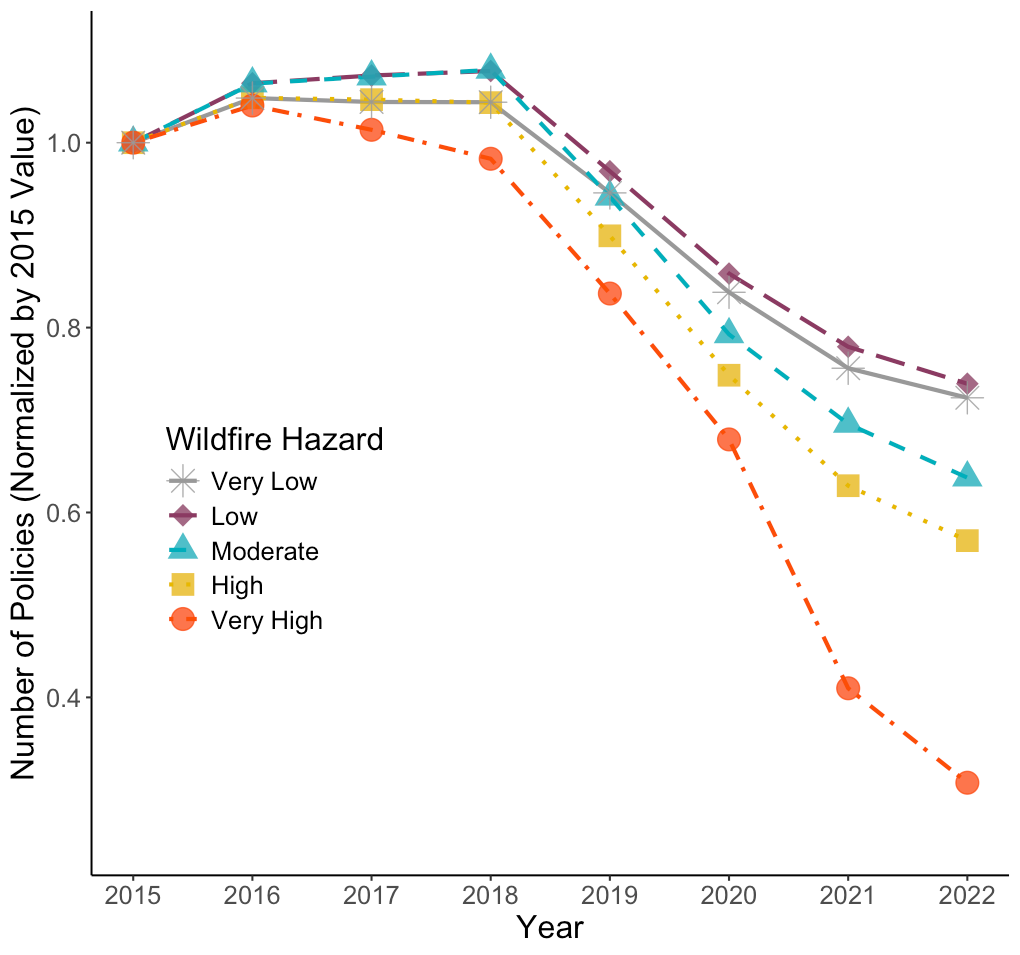
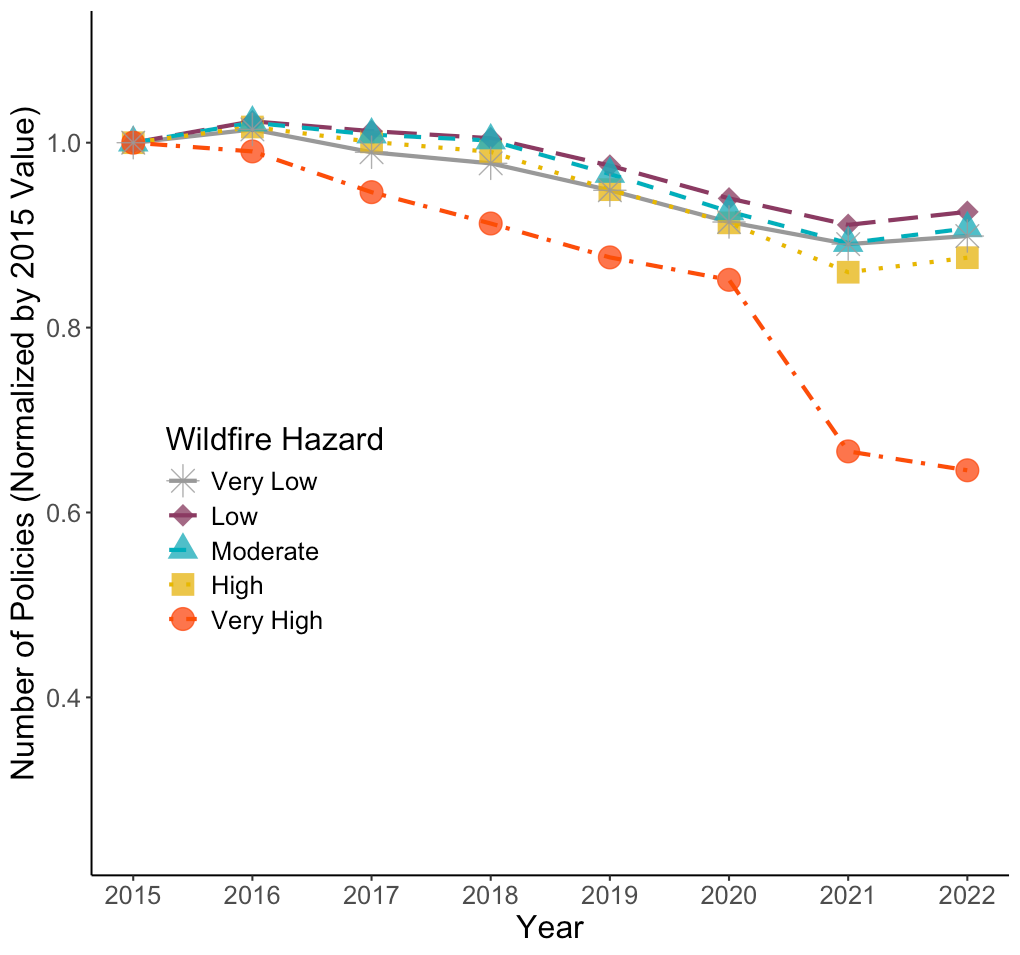
Following those losses, many insurers began to reduce the amount they were willing to insure, particularly in areas with the highest wildfire risk. For instance, while the overall market has shown a downward trend in the number of policies underwritten in fire-prone areas (as illustrated by the orange line in Figure 2A), the decline is most pronounced among insurers that experienced the greatest underwriting losses during the 2017-2018 wildfire seasons (as shown in Figure 2B)(3). From 2015 to 2022, these insurers reduced the number of insured policies in areas with “very high” wildfire hazards by 70%.
Figure 2A: Number of Policies, All Private Insurers
Figure 2B: Number of Policies, Private Insurers with Highest Underwriting Losses over 2017-2018
- The decline in policies included many insurers canceling policies, so-called “non-renewals.”
In response to the growing wildfire risk and concerns about regulatory restrictions on appropriately pricing those risks, several big-name insurance companies stopped writing new policies in the state. In addition, many began “non-renewals,” which is essentially canceling existing policies when the annual term is up. For example, as has been widely reported in recent days, State Farm dropped many policyholders in the affluent and highly fire-prone Pacific Palisades neighborhood, which has now seen widespread devastation.
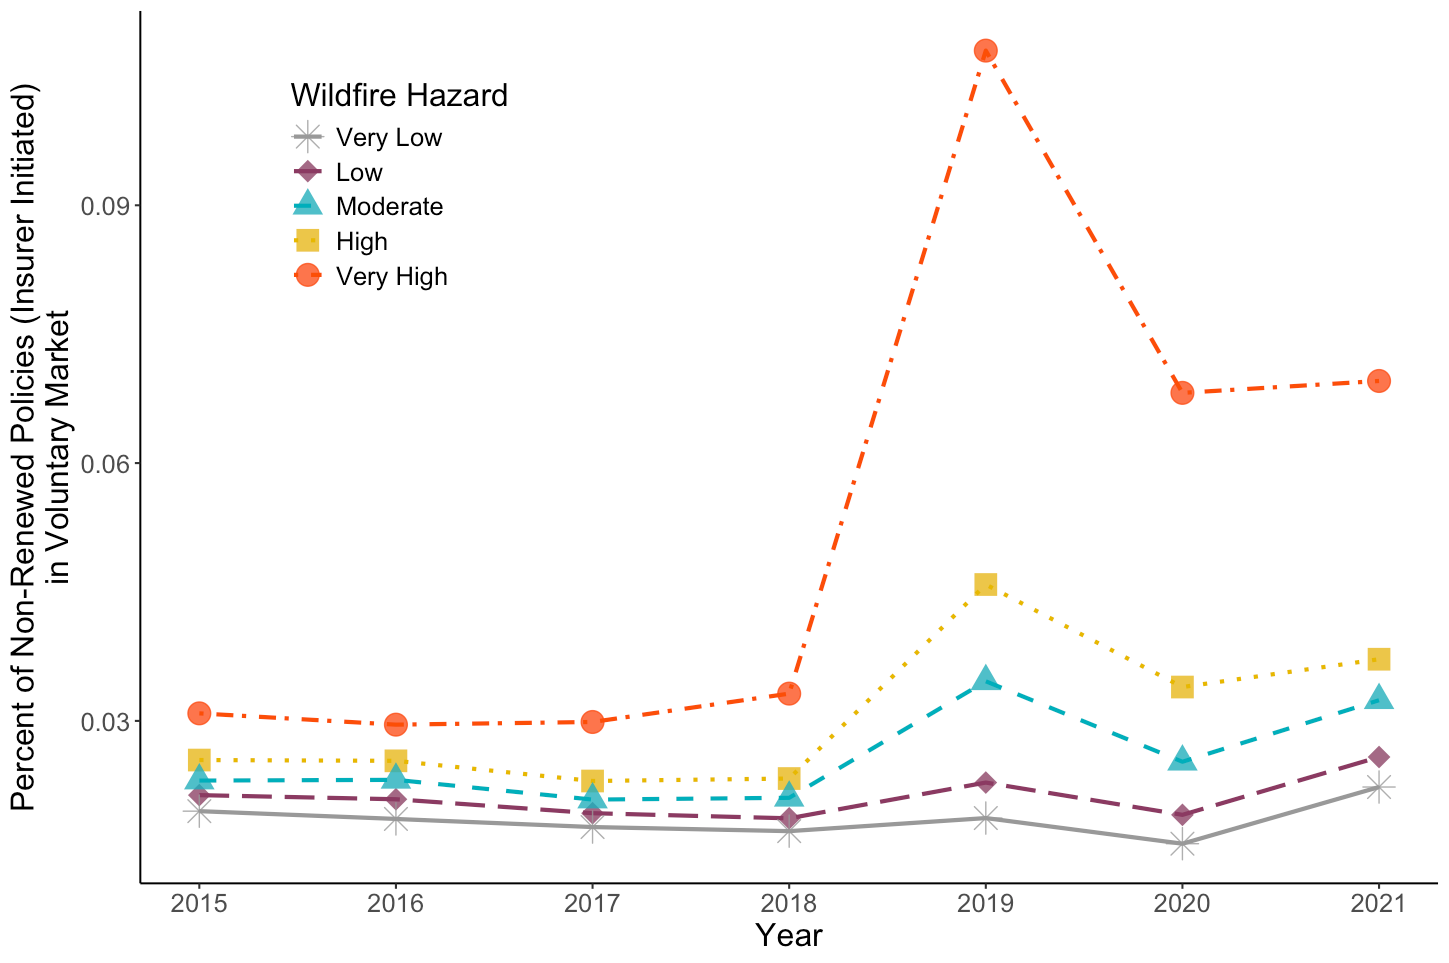
Figure 3A shows how non-renewals increased the most in areas with the highest wildfire risk. In ZIP codes categorized as having “very high” wildfire hazards, for instance, the non-renewal rate peaked at 11% in 2019, with certain ZIP codes experiencing over 20% of policies being discontinued by their insurers. Note that non-renewals are often delayed since, by state law, the insurance commissioner can put in place a moratorium for one year on non-renewals in areas impacted by wildfires. This is done to protect consumers in the immediate aftermath of a disaster. As such, even if the wildfire losses hit in 2020, non-renewals might not spike until later in 2021 or even in 2022.
Figure 3A: Percent of Insurer-Initiated Non-Renewals in the Private Market
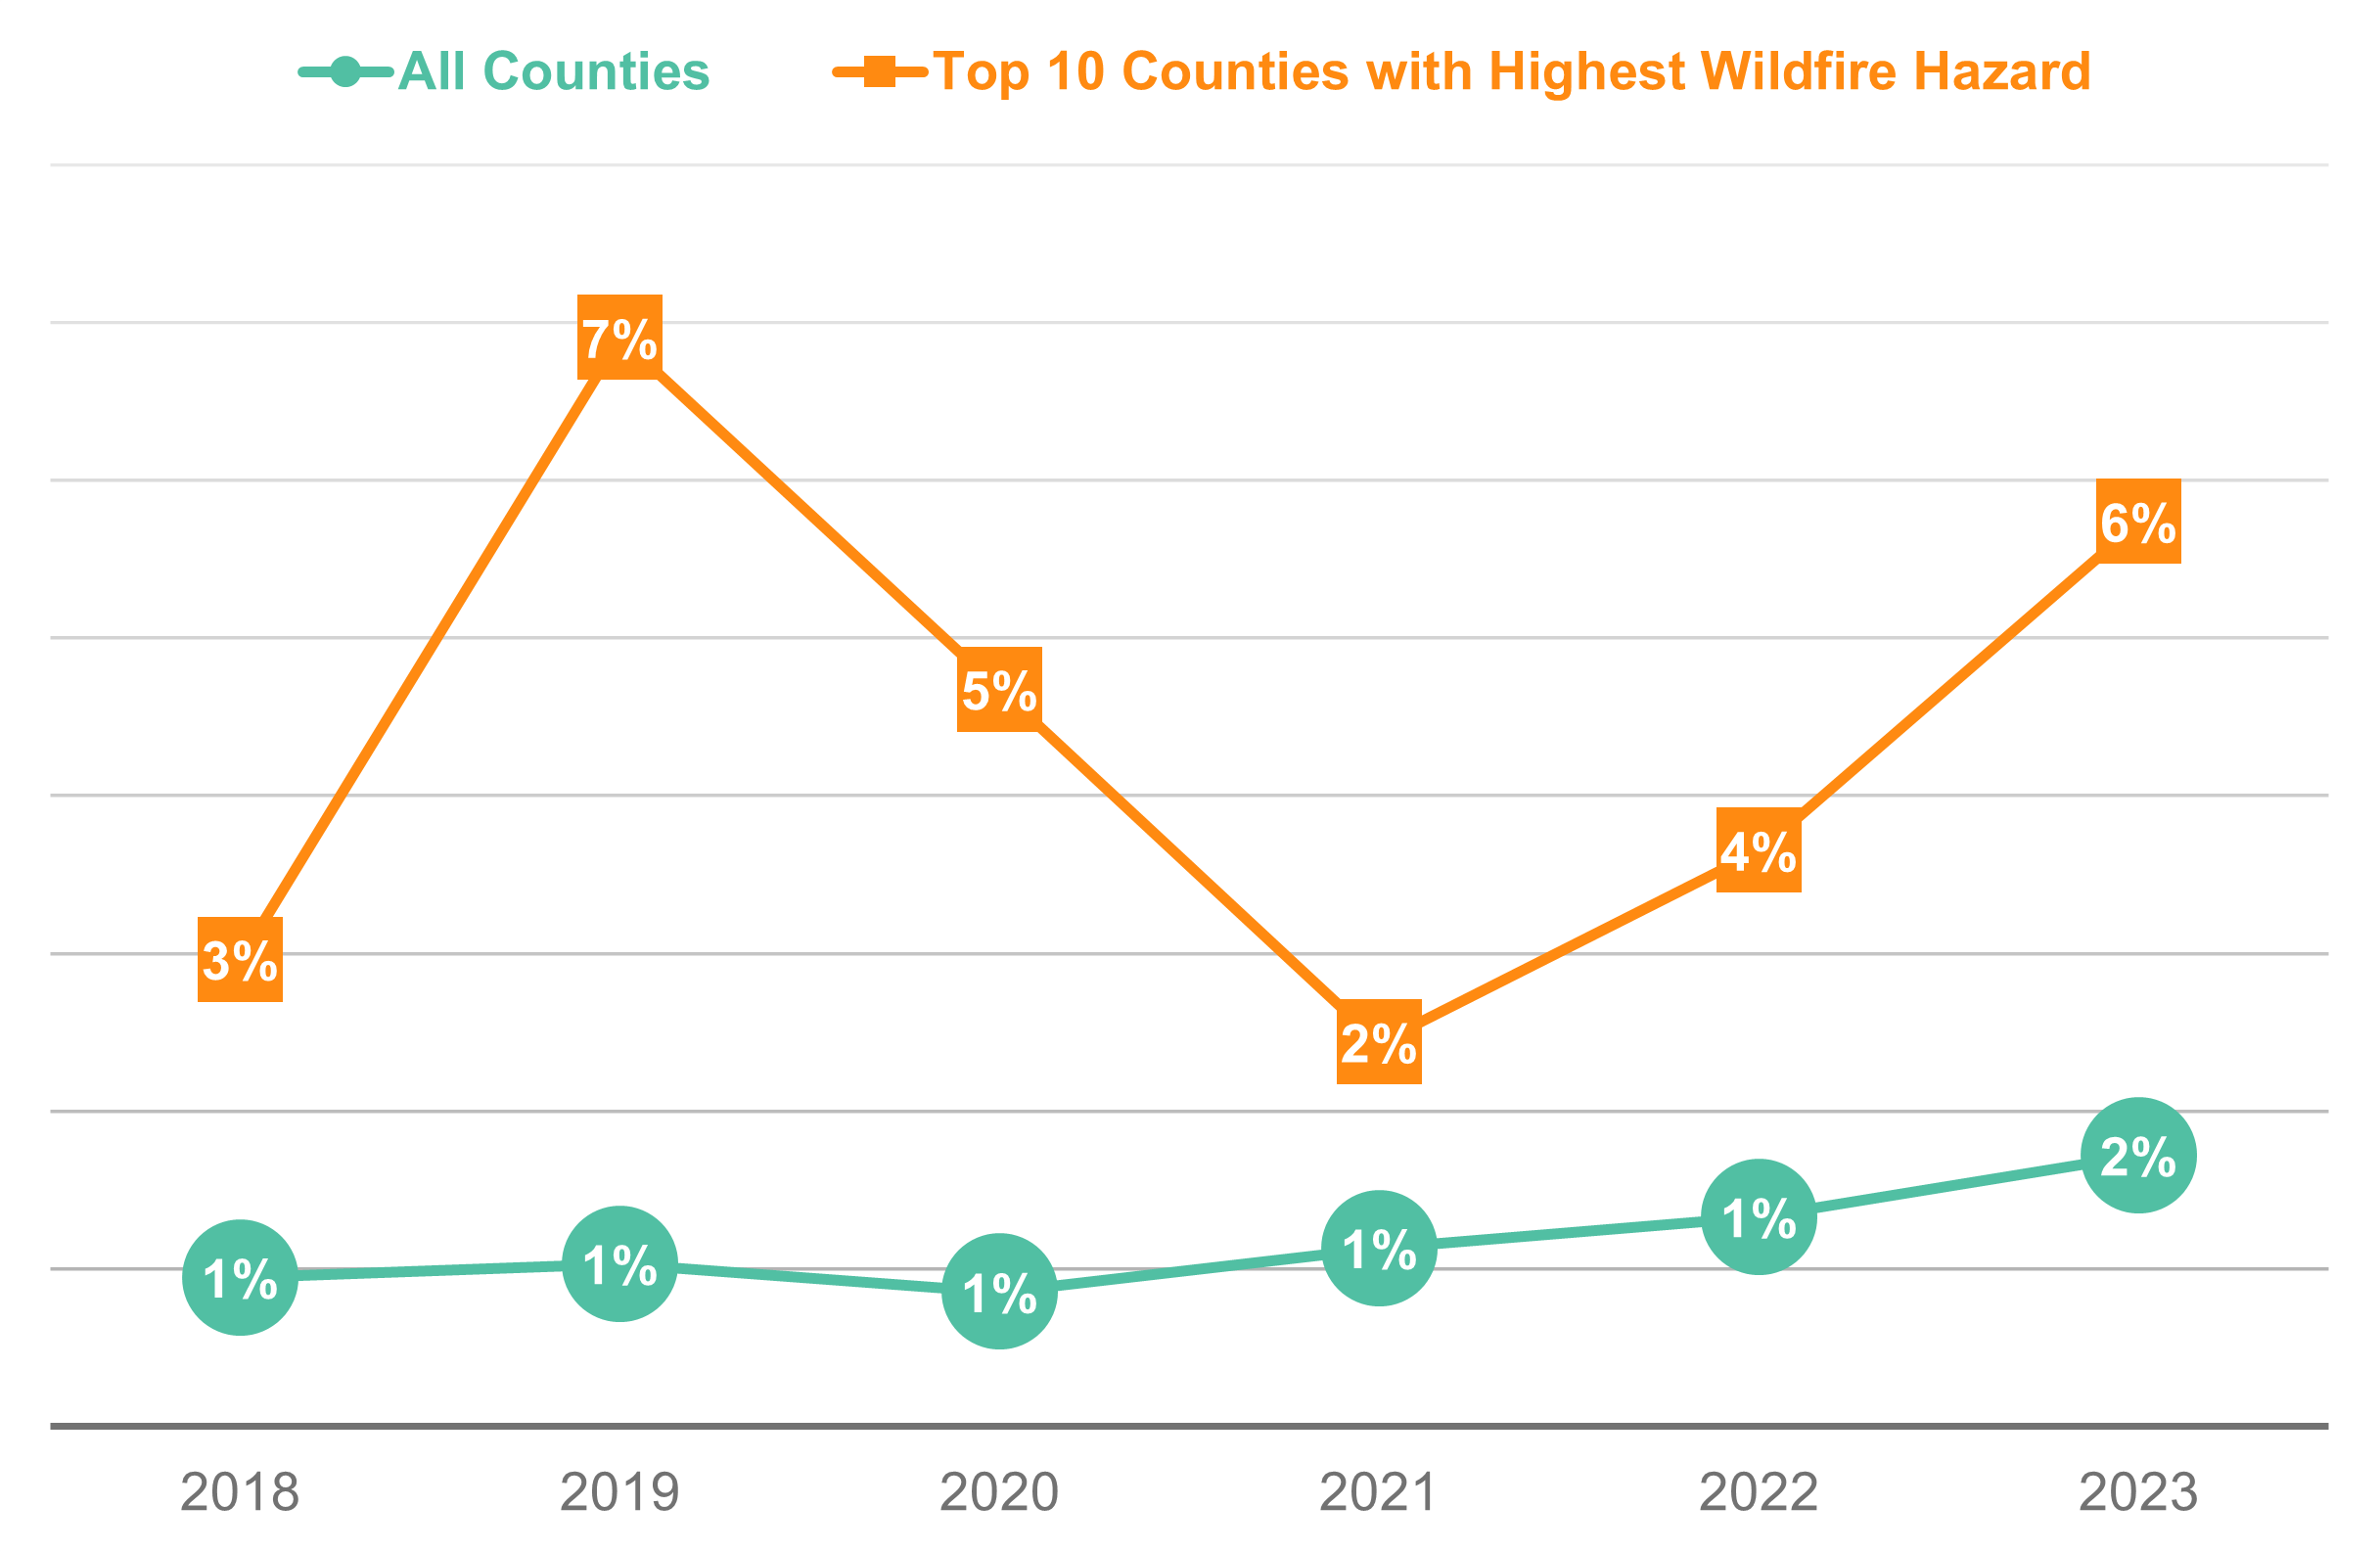
This data for Figure 3A from the California Department of Insurance ends in 2021, but the Senate Budget Committee collected more recent data on this topic. That data, which begins in 2018, is by county and so does not allow as fine-grained differentiation of fire risk. It does, however, include two more recent years of data. In Figure 3B, our analysis of this data confirms that non-renewals in areas of higher wildfire risk have continued in the California market in recent years.
Figure 3B: Non-Renewal Rate in California Counties by Year
- In response to a pull back from private insurers, mortgage lenders have had to force-place more home insurance policies.
Lenders require homeowners insurance for a borrower to take out a mortgage. When the borrower loses their insurance, or cannot find insurance, lenders will secure insurance on their behalf; this is called force-placed insurance. Lenders do this to protect their interest in the property, but the insurance can sometimes be expensive or limited in coverage.
Figure 4 shows the change in the number of forced place policies in California by wildfire risk categories, with 2015 as the comparison year. While the number had declined from 2015 to 2017, after the 2017-2018 wildfire seasons the number grew – and grew quite a bit more for those with properties in very high wildfire risk areas. This again indicates growing stress within the insurance market for these regions of the state.
Figure 4: Number of Lender Force-Placed Policies in California

- Fewer private options have meant that more residents have had to turn to the state’s market of last resort, the FAIR plan.
As private insurance becomes harder to find in very risky areas, or prohibitively expensive, more residents have had to turn to the state’s FAIR plan, or the insurer of last resort, for coverage. This program is a non-voluntary association of admitted insurers in the state and must provide coverage to any property owner. While it was established by state statute, it is not a state agency or public entity and does not rely on taxpayer funding.
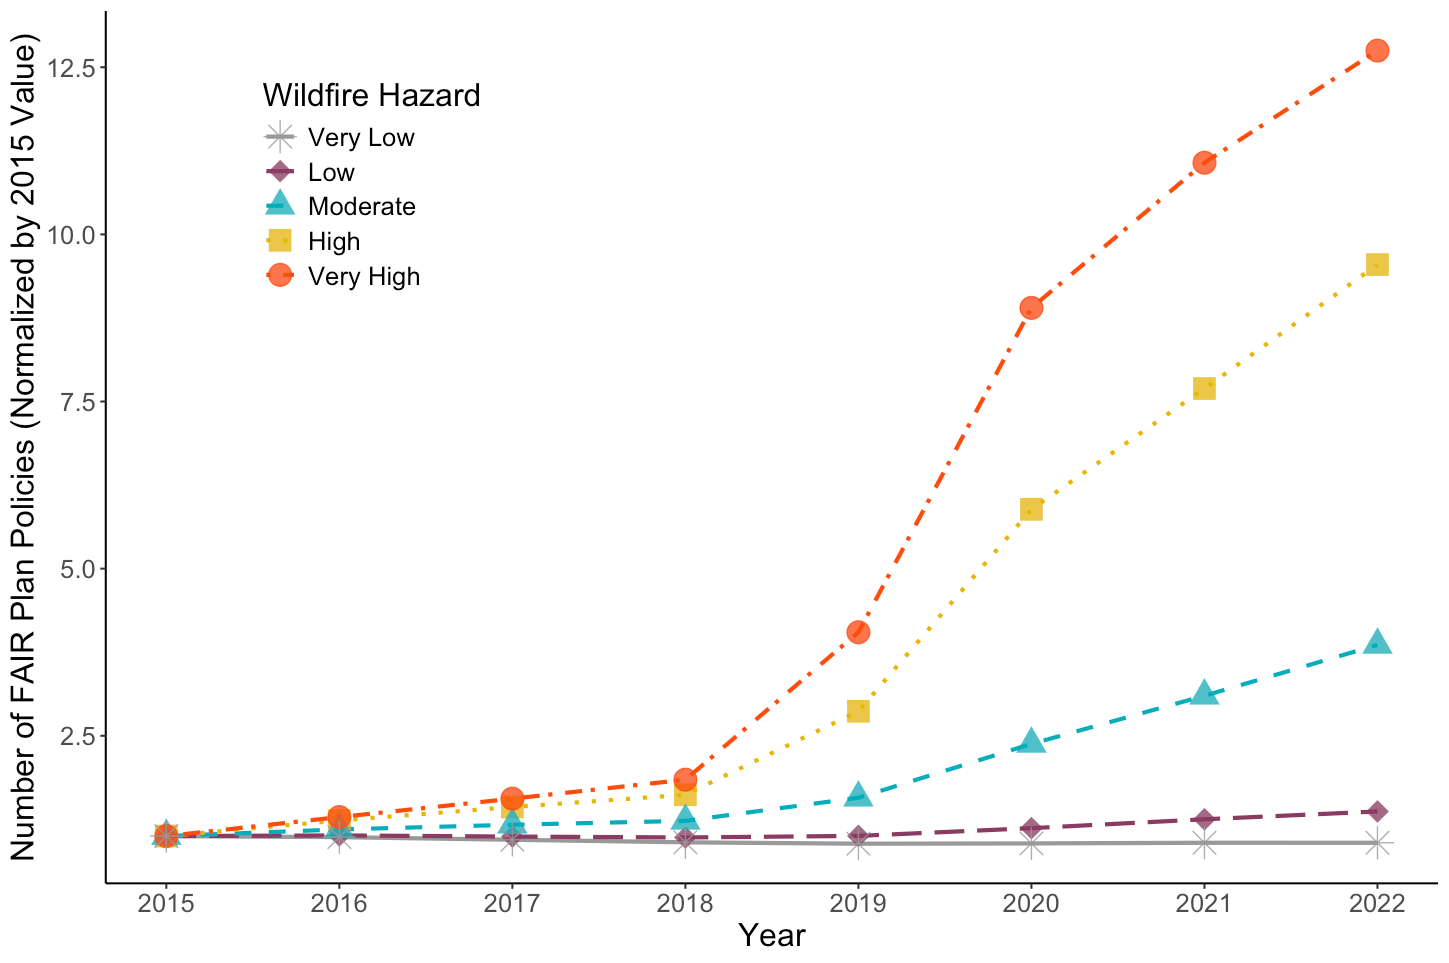
Figure 5A shows the number of policies in the state FAIR plan by year. The enormous growth, which really began in 2019, is evident and has not shown signs of slowing. As of this past September, there were 451,000 policies in the FAIR plan. In Figure 5B, we also observe that the number of FAIR plan policies has disproportionately expanded in the highest-risk ZIP codes since 2019. By 2022, FAIR plan participation in these areas was more than twelve times higher than in 2015.
Figure 5A: Total Number of FAIR Plan Policies, 2009-2024
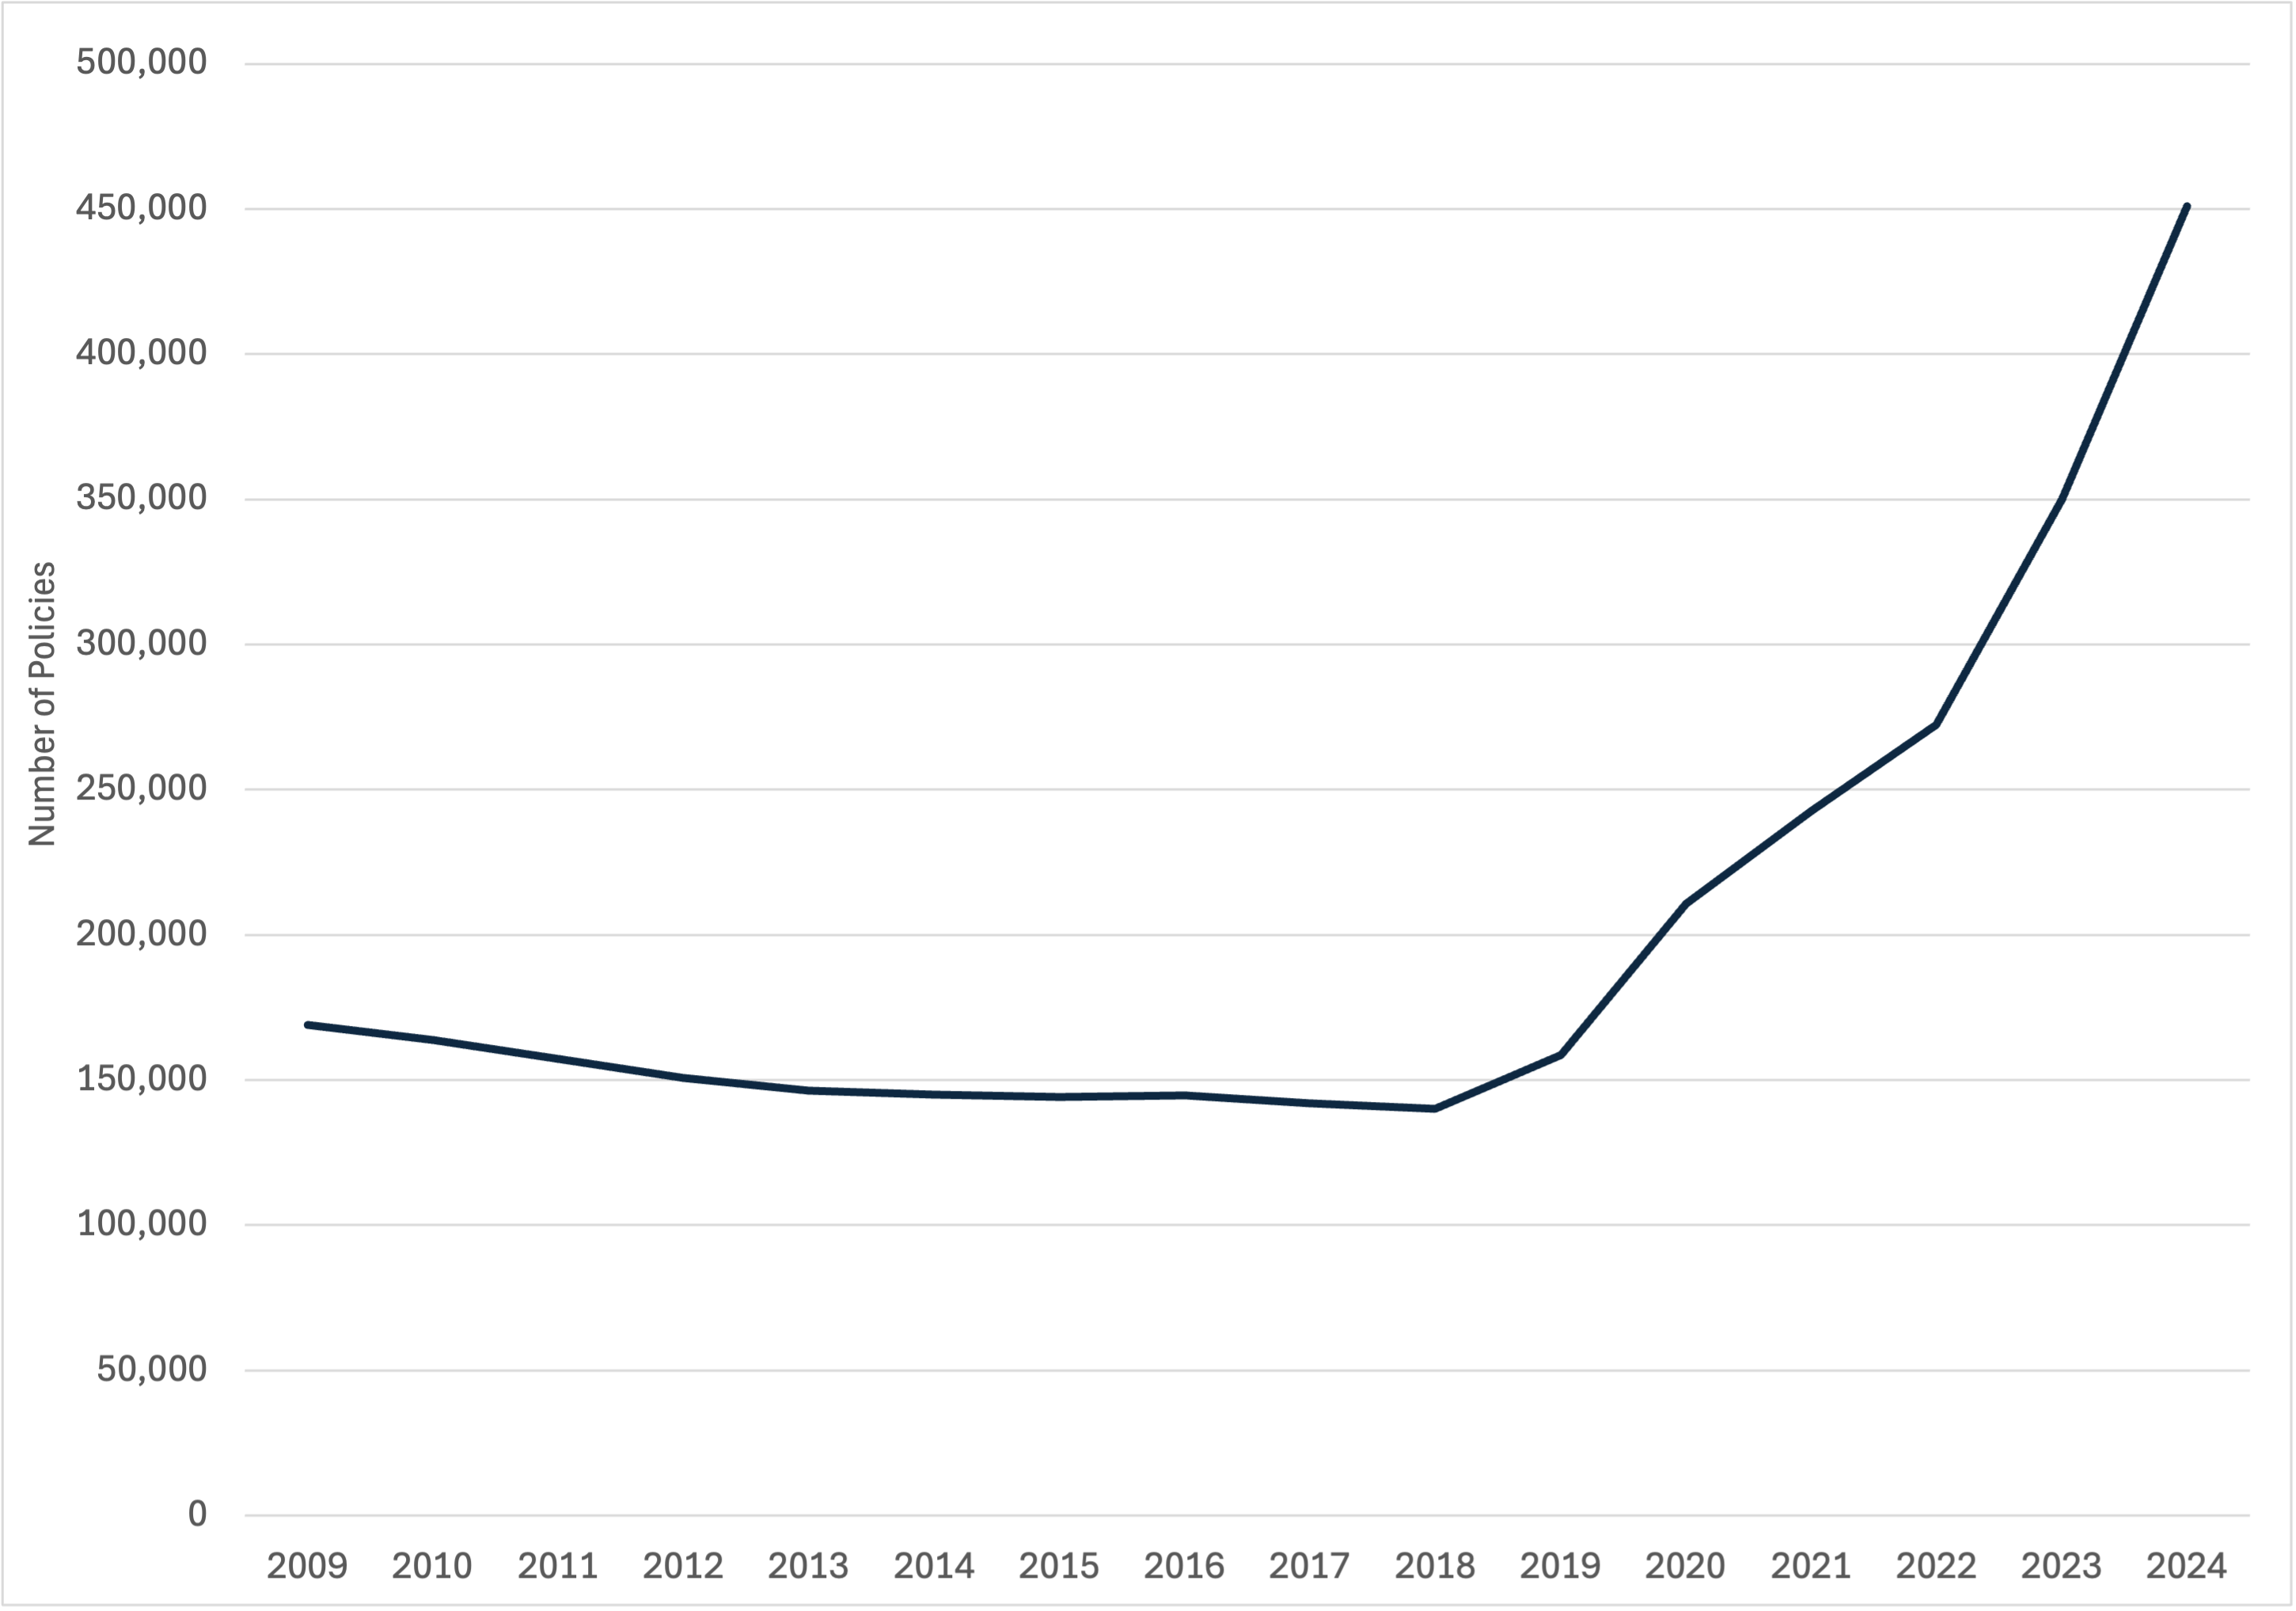
Figure 5B: Change in the Number of FAIR Plan Policies by Wildfire Hazard
In total, these policies represented $458 billion in exposure as of this past fall, with reported exposure of $5.9 billion just in the Palisades. This amount is up from only $50 billion in 2018. Despite this large exposure, the surplus of the plan last spring was only a couple hundred million. Experts doubt the program will be able to cover the claims it will now face, making assessments (i.e., a charge levied on insurance companies participating in the FAIR plan) necessary. These assessments will further increase the cost of insurance in California in the coming years since insurers can pass on much of the assessment to their policyholders. Other states also rely on post-event assessments for state-created insurance programs, such as Florida Citizens. These financial structures can create a large cross-subsidy from future policyholders to those at risk now and from lower-risk policyholders to the highest-risk policyholders.
- Premiums have also gone up (as well as deductibles) in fire-prone regions over the past several years.
For those still able to get a private insurance policy, average premiums have been trending upward – like many places around the country. In 2015, the average homeowners insurance policy for an owner-occupied home cost $1,026. By 2022, this amount had risen by 54% to $1,576. As shown in Figure 6A, the average premium has been rising at a faster rate in areas with the highest wildfire risks, particularly in recent years. From 2015 to 2022, these “very high” risk areas saw an average increase of over 80%. Nevertheless, even with notable premium hikes in these fire-prone regions, the insurance costs paid by many California homeowners remain lower than those in several other parts of the country where the risk of wildfires is minimal, likely due to regulatory restrictions in the state that have only recently been revised.
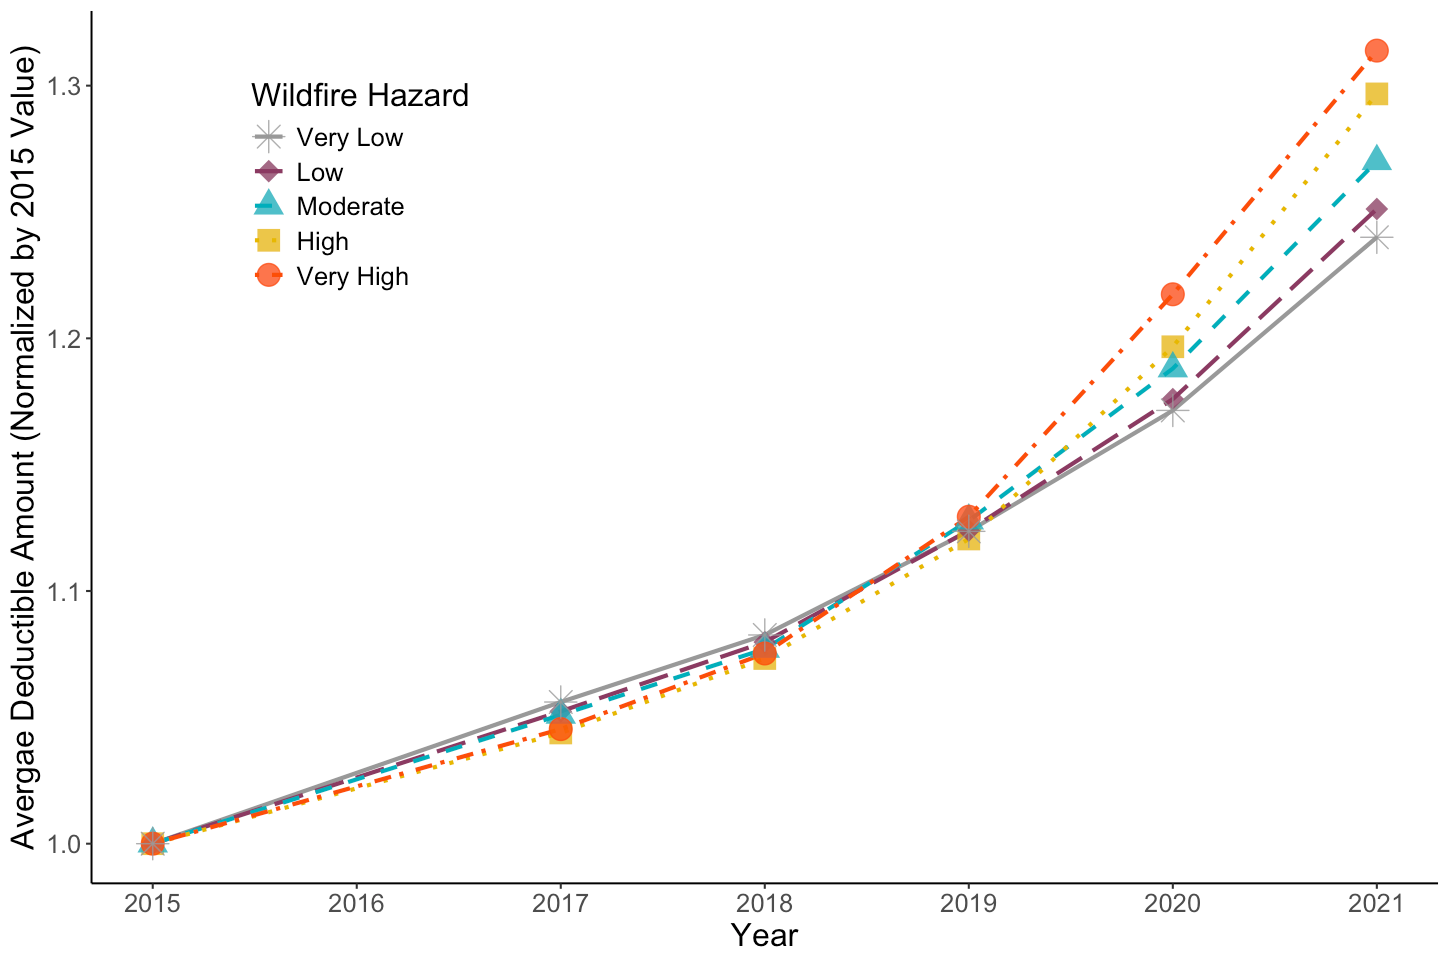
Meanwhile, average deductible amounts have also been rising over the years, with the highest wildfire risk areas seeing the largest increase in deductibles, as shown in Figure 6B. This trend suggests that many residents may be opting to assume more risk themselves in order to reduce their annual premiums. Coverage amounts have not changed substantially across areas with varying levels of fire risk.
Figure 6A: Average Premium Per Policy in the Private Market
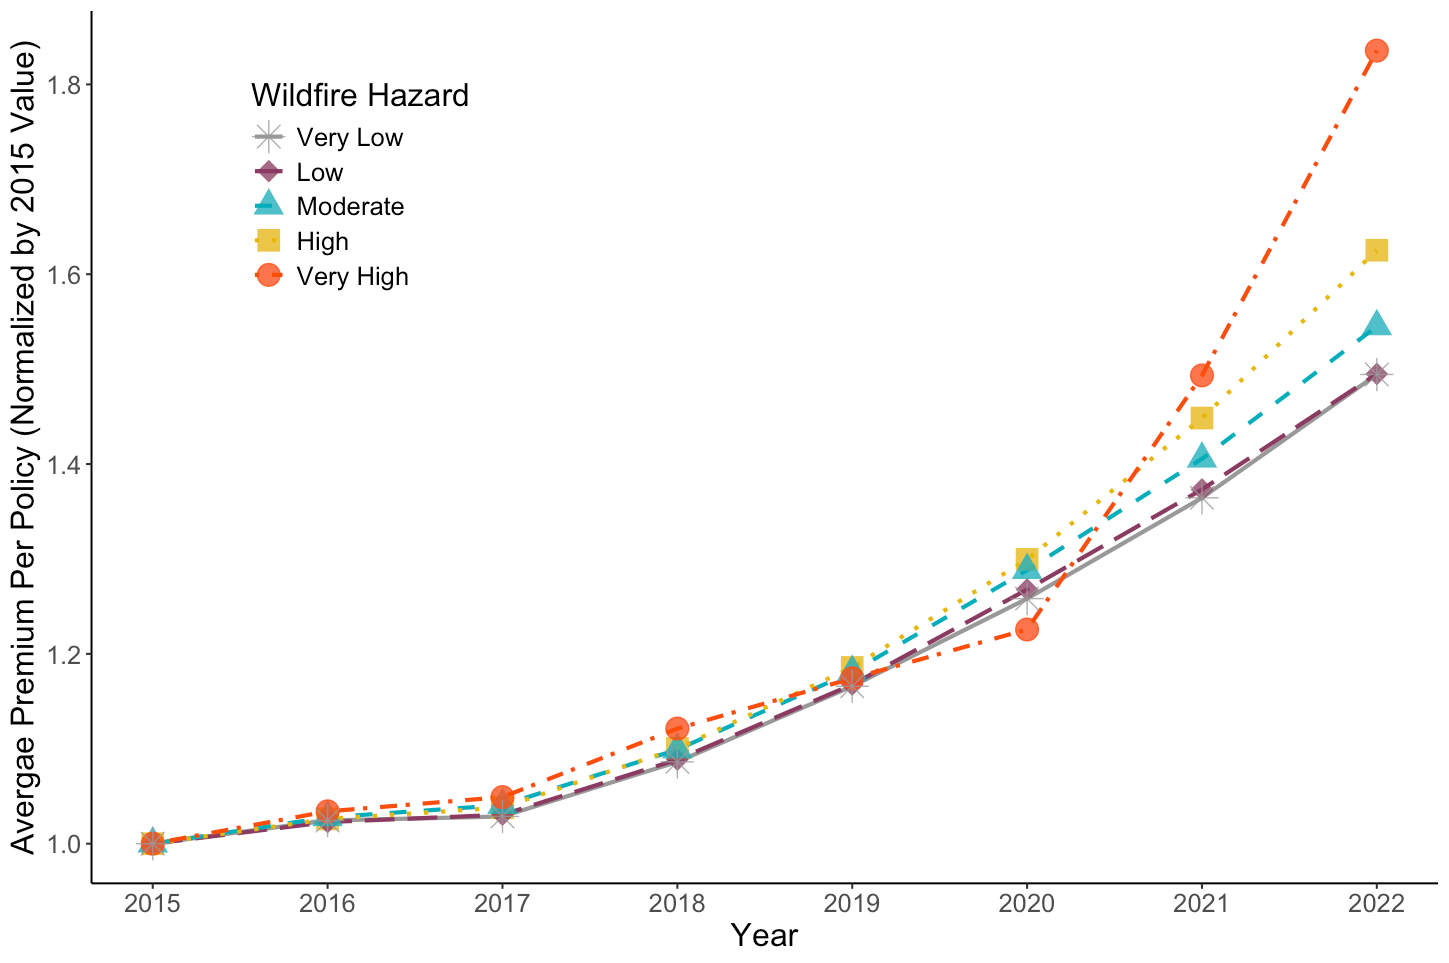
Figure 6B: Average Deductible Amount in the Private Market
What’s next?
Before the current fires, the California Department of Insurance had made many notable changes to stabilize the insurance market and make more coverage available in wildfire-prone areas of the state. As part of its “Sustainable Insurance Strategy,” the Department has advanced changes that would allow insurers to use catastrophe models for their rate-setting, recoup the cost of reinsurance, and expect faster rate reviews from the department. In exchange, insurers must write a minimum number of policies in designated distressed areas – which are places with higher wildfire risk. In addition, the Department required that insurers that differentiate their rates based on wildfire risk must also include discounts for certain wildfire risk mitigation measures at both a community and property level. Combined, these changes will no doubt provide improvements in market conditions.
That said, two big challenges remain for the state. The first is that there is an ongoing tension between having insurance be available and having it be affordable. And the second is that risks are growing dramatically and absent massive investments in lowering future losses, the long-term outlook for insurability remains questionable.
When risks are high, insurance is both harder to come by and more expensive. Across many parts of the nation, the risks of climate disasters are rising rapidly as climate change advances. In California, it is now commonly understood that the wildfire season is year-round. Indeed, the most recent outbreak in L.A. just showed us that wildfires are occurring much earlier in the year and are becoming more frequent and intense than ever before. Typically, it is rare to see a wildfire of this size at this time of year, as you can see from Figure 7. Looking back, 2024 was our hottest year on record, and it may turn out to be one of the coolest years in your children’s lifetimes–a sobering fact.
Figure 7: Cumulative Number of Structures Damaged in California Wildfires

In this kind of environment, insurance is unlikely to be cheap and finding consensus policy solutions is difficult. While there have been calls to expand publicly-provided insurance, those programs still face the same difficult economics of insuring catastrophe. We suggest two important pieces of future solutions: (1) risk reduction must be prioritized, especially now during rebuilding, and (2) assistance in the costs of insurance should be prioritized for lower-income households who often need the financial protection of insurance the most but are least able to afford it.
(1) To assess a ZIP code’s exposure to wildfire risk, we use the Wildfire Hazard Potential (WHP) map developed by the USDA Forest Service. The WHP map quantifies the relative potential for difficult-to-contain wildfire incidents and assigns six WHP ratings (i.e., 0 = non-burnable, 1 = very low, 2 = low, 3 = moderate, 4 = high, 5 = very high) to all areas across the entire U.S. at a 270-meter grid resolution. We calculate the wildfire hazard for each California ZIP code as the weighted average of the WHP ratings based on the share of developed areas that fall within each WHP rating category. For example, if 100% of the developed areas within a ZIP code are classified as having a WHP rating of 5, then that ZIP code will also have a wildfire hazard rating of 5. The final wildfire hazard rating for each ZIP code ranges from 0 to 5, with higher ratings indicating a greater risk of fire. Subsequently, we categorize all California ZIP codes into quantiles based on their calculated wildfire hazard ratings.
(2) An insurer is defined to have underwriting losses if its combined ratio is greater than one. The combined ratio is calculated as the sum of direct losses incurred, direct defense cost incurred, commissions and brokerage expenses, and taxes & license fees divided by direct premiums earned. As such, it indicates how much an insurer paid out in losses and expenses for every dollar they collected in premiums.
(3) Insurers with the highest underwriting losses are defined as those with a combined ratio greater than 2.5 (i.e., at the highest quartile) for the years 2017-2018. These insurers represent 20% of the overall market.


