How new data is helping West Oakland clear the air
Fern Uennatornwaranggoon is EDF’s Air Quality Policy Manager.
Community groups are using California’s first-of-its-kind Community Air Protection Plan to reduce pollution in the city’s most impacted areas.
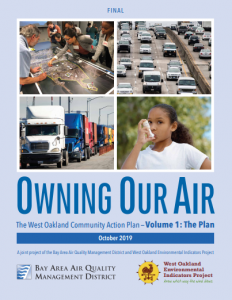
The fight for healthier air in West Oakland spans generations. Just Ask Ms. Margaret Gordon, who has been at it since 1992. “I’ve had 16 grandchildren and one great-grandchild since then,” says the co-director of the West Oakland Environmental Indicators Project (WOEIP). Two years ago her community’s efforts got a much-needed boost: California passed AB 617, establishing a program requiring the state to reduce air pollution in those areas most impacted. Under the Community Air Protection Plan, community groups, environmental organizations, industry and local air districts work with the California Air Resources Board (CARB) to develop improvement plans.
Ms. Margaret, who has been an integral part of West Oakland’s efforts, tells EDF’s Fern Uennatornwaranggoon how the plan unfolded and how data gathered from Google Street View cars fed into its development.
Fern: Why did CARB turn to WOEIP to facilitate the community air plan?
Ms. Margaret: We were asked, because of the work we have done over the last 25 years on air quality. We had demonstrated our capacity to participate technically with the air district staff. In 2015 and 2016, we started doing the air monitoring with EDF, Google, the University of Texas and Aclima, and we also deployed 100 sensors with UC Berkeley throughout West Oakland for the 100×100 project.
Fern: WOEIP and the local Air District serve as co-leads for the plan. What was the process like for developing it?
Ms. Margaret: We had a partner agreement and a charter that outlined tasks, roles, materials development, who was going to meet with whom, and what technology we were going to use. And we had neutral facilitators to support the process—all those things were identified up front. We had a steering committee that met once a month for 17 months. Steering committee members had to residents or be part of an organization within the defined target area, so they could report back to their groups. We had people from neighborhood associations and business groups, the port and a truck working group.
Fern: So what were the steps you had to go through to get to the plan?
Ms. Margaret: We had to merge the modeling with the monitoring, and we had to communicate that to the West Oakland community. We worked with the Bay Area Air Quality Management District engineers and scientists to break down the information into small bites so people could clearly understand what we were talking about—it wasn’t dumbing it down, but we didn’t want to overwhelm people. The other part of the work was developing the strategies to reduce pollution. Some of the strategies came from the co-leads, but 75% came from the residents, based on the things they saw impacting emissions in West Oakland. The strategies were all based on 4 areas of concern: exposure, proximity, land use and enforcement.
Fern: How did the data from the Google study help in developing strategies to reduce pollution?
Ms. Margaret: It helped us establish priorities and gave us ground-up evidence we’d never had before The Google car data was the first time outside of us having our own backpacks that we were able to establish on-the-ground air monitoring. It showed us hot spots, more hyperlocal, more refined data than we’d seen before. It gave us another set of lenses to hone in and really focus on certain areas. And then to overlay that with the Kaiser Permanente health data—showing cardiovascular disease. That closed a lot of gaps and connected the dots.
Fern: How did the community use data to influence the truck plan on 7th street, which is designated as a truck route?
Ms. Margaret: Between Brush Street and the Frontage Road is where we have very low- to medium-income housing. This is one of the highest sensitive receptor areas.
Fern: There’s a higher density of children under 5 and a bunch of childcare centers.
Ms. Margaret: A school, a neighborhood clinic, the family resource center, stores, and a commercial area. It’s a multi-racial community living along that corridor, and we have a homeless population.
Fern: The city had proposed prohibiting trucks from near Frontage to not quite Market, but then from Market almost all the way to the 980, they’d just leave it as is. How do you think the data addressed that?
Ms. Margaret: Looking at the data and seeing pollution all the way on 7th street, the city is looking at the truck plan again and maybe banning truck traffic along the whole stretch. They have to study it first.
Fern: It’s also worth mentioning that you and your team has been using the air quality maps for educational and outreach purpose. And next month, the Oakland Museum of California will be featuring WOEIP’s work on air pollution and this kind of spatial data in a new exhibition.
Fern: Did you learn anything in this process that would be useful to other communities trying to reduce pollution?
Ms. Margaret: You have to have the commitment and the foresight and be willing to see the light at the end of the tunnel, to go through the hoops and the barriers and the challenges. And you have to be able to transcend your skills to other people within your community, while also transcending the understanding of agency staff and business. We have to figure out how we could coexist to make this better—this is all about collaboration and problem solving and having real, authentic equity in doing what needs to be done. And it’s not always about complaining but also having some resolution.
Learn more about our air quality mapping projects in Oakland.


