


This is the third in a series of Global Clean Air blogs on COVID-19 and air pollution. EDF scientists and program experts will share data about pollution levels during quarantine from a local and global perspective, and provide recommendations for governments and companies to Rebuild Better.
COVID-19 means a lot more online shopping, which means a lot more delivery trucks that could contribute to a lot more air pollution in our neighborhoods.
As coronavirus shut down the economy, some regions saw a drop in air pollution. But as economic activity picks up, so does pollution — and if the habit of doing more shopping online persists, we could end up with worse air quality from fleets of diesel-powered delivery trucks.
At-home delivery is contributing to growing demand for freight movement, which is driving increased consumption of fossil fuels, especially diesel, and worsening air pollution. In fact, Amazon’s carbon emissions climbed 15% in the last year alone — even before coronavirus — due to increased sales.
During this pandemic, at-home shoppers are deluged with purchases arriving by cardboard box, each delivered by polluting trucks. Our new video encourages consumers to let companies know they’d like them to make the last mile of delivery to come from a zero-emissions vehicle, cleaner shipping options and local delivery lockers. “Getting a finished product from the factory to your door, has costs beyond the price tag. More trucks are making more trips, hurting the planet, and our health.”
Along with Amazon, other leading last-mile delivery companies include FedEx, UPS, XPO, USPS and Walmart. While startups have dominated the zero-emissions last-mile space, household names are starting to pilot new solutions, including an order for 10,000 electric delivery vehicles by UPS, and an all-electric box truck by Daimler.
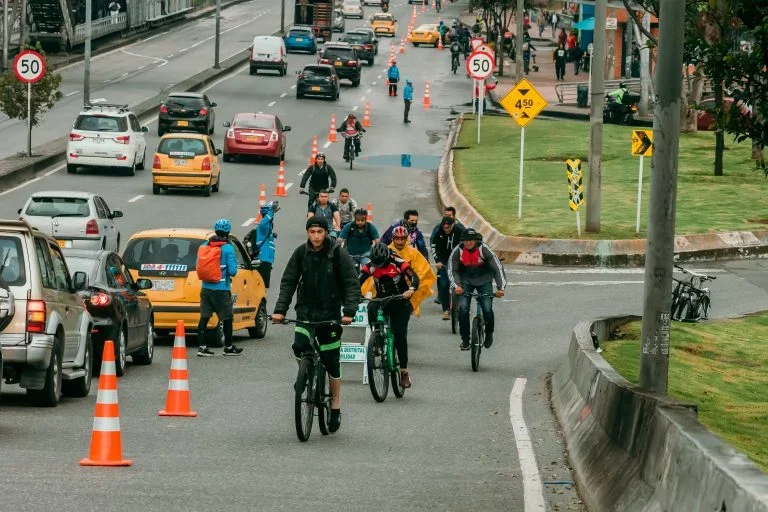
The economy is slowly bouncing back in some areas. Streets are crowded with pedestrians, bikers, cars and trucks as some businesses open. But while it’s comforting to see signs of “normalcy” returning in some regions, our health and our planet depend on our ability to find innovative solutions for building back, better.
The pandemic reinforced the fact that the risks of air pollution are real and personal, and that our health and our ability to fight respiratory diseases like COVID-19, depends on clean air. Stakeholders across the globe are paying more attention than ever before to air pollution, and demanding leadership and action not just from government, but also from the private sector.
Delivery: a big air pollution challenge, but also opportunity

Aileen Nowlan, Senior Manager, EDF+Business
As companies get back on their feet, business leaders can integrate strategies for reducing air pollution into their already existing climate goals by focusing on pollution from the last mile of delivery. Because right now, air pollution is impacting their bottom line, employee health and the economy — all the places we can least afford to be hurt.
Many leading companies have made public climate commitments — now, they’re busy designing strategies for meeting them. Fortunately, because poor air quality and climate change share many common sources, many of the solutions for reducing climate pollution can also decrease local air pollution. Using zero-emissions shipping will help companies meet their climate targets, while also improving public health, especially in some of our nation’s most vulnerable communities.
This period of rebuilding is the perfect opportunity for businesses to collaborate on zero-emissions shipping and test out innovations like e-cargo loading zones in cities. And some companies already are — like DHL, which recently launched an e-cargo bike trial in Miami to reduce both congestion and pollution.
Business leaders rose to the immense and immediate challenge of protecting the health of their employees and communities amid the pandemic. This same leadership needs to be sustained and extended to how companies approach climate change and air pollution.
Air pollution is a financial and reputational risk
Air pollution costs the global economy $225 billion dollars every year in lost labor income.
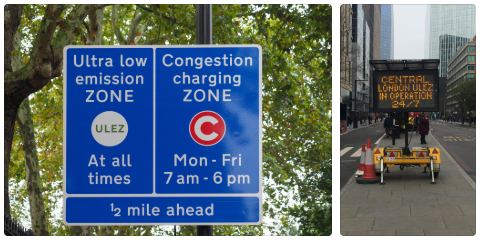
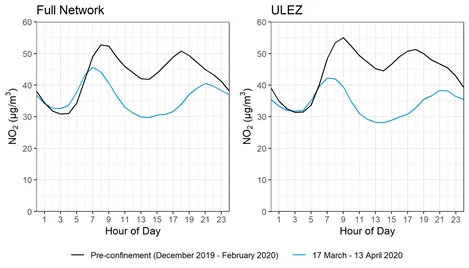
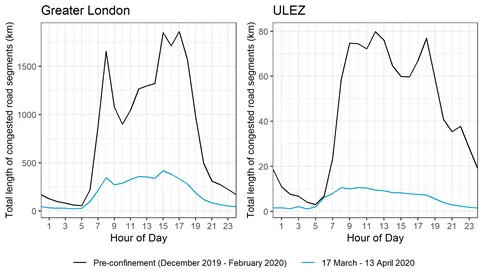
Poor air quality poses a risk to employee health — with coughs, sore throats, and asthma attacks likely to become more frequent. This all leads to more sick days — air pollution in central London is shown to cause the equivalent of over 650,000 sick days each year. Cities that that have severe air pollution problems will increasingly be seen as less desirable places to work and live — thereby negatively impacting talent recruitment. EDF scientists have been working on advancements in hyperlocal air pollution sensors, which are providing incredibly detailed insights about specific facilities, roads or neighborhoods and how air quality may change at those locations over the course of a day, week or year. We can now pinpoint hotspots, examine their causes, and develop solutions tailored to each city — or, in some cases, each intersection. As localized insights make pollution personal, companies will be called to account for their pollution.
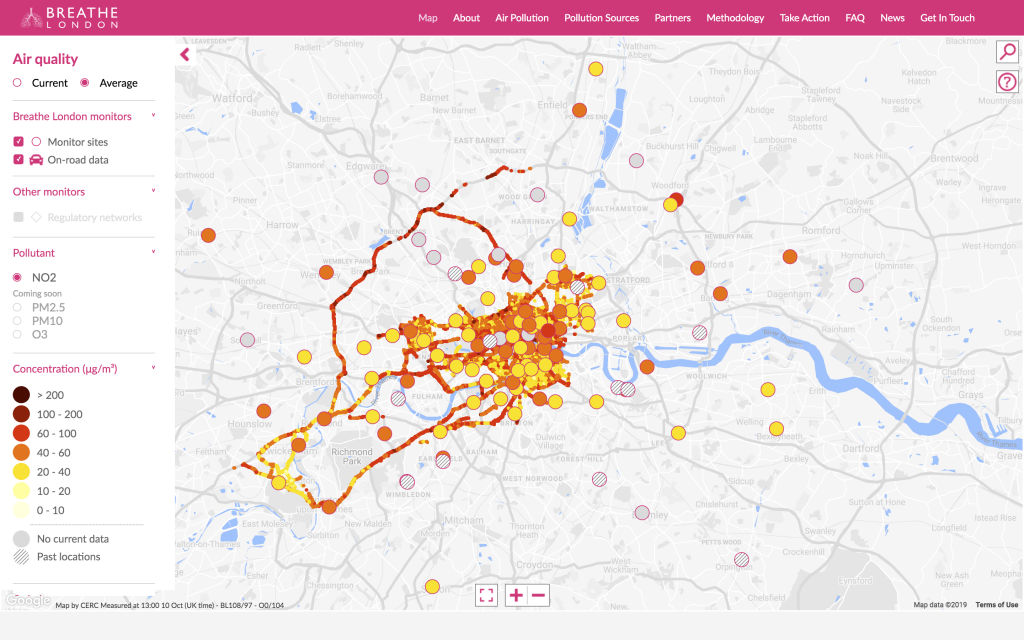
Data from EDF’s hyperlocal air pollution monitoring in London have been used to map the city’s air pollution at a street level.
This was originally posted on EDF Business.