Global Clean Air

Vital global initiative will accelerate clean air solutions in cities

Everybody deserves the right to breathe clean air. Yet air pollution is choking cities and communities around the world – a staggering 9 in 10 people breathe unhealthy air. 

City leaders need to urgently identify and accelerate solutions across the world. That’s why the U.S. Agency for International Development (USAID) is launching a bold initiative – called Clean Air Catalyst – to help cities around the world reduce air pollution by advancing solutions that protect health, promote equitable prosperity and tackle the climate crisis.  Through a global consortium of organizations led by the World Resources Institute (WRI) and Environmental Defense Fund (EDF), Clean Air Catalyst will begin in two pilot cities: Indore, India, and Jakarta, Indonesia. In Jakarta, WRI Indonesia is the implementing organization.

To mark the initiative’s official launch, hundreds of people from around the world attended a virtual conversation on clean air, health and climate solutions with U.S. Senator Bob Menendez and USAID’s Karl Fickenscher, as well as representatives from partners and the pilot cities. Here’s what you need to know. 

Read More »

Posted in Climate, Concerned Citizen, Energy, Environmental Justice, Government Official/Policymaker, Health, Homepage, Partners / Comments are closed

Deprived and BAME schoolchildren in London experience greater air pollution burden

By: Greg Slater, data analyst

Air pollution varies dramatically across London, which means not all schoolchildren have the same start in life.

Using a powerful new dataset, we found that pollution is significantly higher at primary schools with more students from deprived areas, as well as at schools with a higher proportion of students of Black, Asian and Minority Ethnic (BAME) background. With vehicles a major contributor, pollution is also unsurprisingly elevated closest to the cities’ main roads.

Damaging health

Nitrogen oxides (NOx) pollution is a toxic chemical cocktail that includes nitrogen dioxide (NO2). Road transport – especially diesel vehicles – is a major source of NOx, which can inflame airways and aggravate existing heart and lung conditions.

In fact, recent research shows living near busy roads in London, where NOx pollution is high, may stunt lung growth in children by 12.5%.

Stark inequity

New modelled data produced by Cambridge Environmental Research Consultants as part of the the Breathe London pilot project has allowed us to look at the estimated level of NOx pollution at every London state primary school in 2019.

Our analysis reveals that air pollution does not affect all schoolchildren equally, with children from deprived neighbourhoods exposed to more pollution. When examining the deprivation level (a measure that incorporates a broad range of living conditions, including income, health and access to resources), we found that average NOx levels at schools with pupils attending from the most deprived areas were 27% higher than those at schools with pupils attending from the least deprived areas.

We also found that white students are exposed to less pollution at school. Using the modelled pollution data and census data to estimate the proportion of students of BAME background at each school, the results show that schools with the highest percentage of non-white pupils have average NOx levels that are 28% higher than schools with the lowest proportion of BAME students.


Pollution from road transport

By looking at the rise and fall of schools’ NOx levels over the course of a day, we see that pollution peaks around 7-9 am. The chart below also depicts how much is coming from distinct sources, revealing that about 50% of the pollution comes from vehicles during these morning hours. This is when children are typically traveling to school and more likely to be exposed to pollution.


We also found that pollution is on average 25% higher at schools within 100 metres of London’s ‘Red Routes’ – with the bulk of local pollution again coming from road transport. Red Routes are the city’s major roads, managed by Transport for London on behalf of the Mayor of London.


The number of children studying near these roads varies significantly across London. For example, 20% of primary schools in Wandsworth are near a Red Route compared to 8% for an average London borough.

It’s clear that not all children currently have an equal chance at a healthy future – with deprived and BAME children breathing in significantly more pollution at their primary school. Measures that cut pollution from vehicles and reduce exposure, especially along the Red Routes, are essential to address this inequity and protect young lungs.

Cambridge Environmental Research Consultants produced the NOx pollution dataset as part of the Breathe London pilot project.

EDF Europe provided a data analysis on air pollution at London primary schools to the London Assembly for its February 2021 report.

Posted in Health, Homepage / Comments are closed

The Breathe London Blueprint is here to guide your city’s monitoring project and inspire clean air action.

A key question for any city considering using lower-cost sensors or mobile monitoring to measure air pollution is, “Can they provide reliable data and insights?”

The short answer is yes and more, as we describe in our Breathe London Blueprint. The Blueprint is a guide that provides essential lessons for cities interested in using hyperlocal monitoring to turn data into clean air action.

The pilot project

For two years we managed the Breathe London pilot project, an ambitious, collaborative effort to map and measure air pollution across the city.

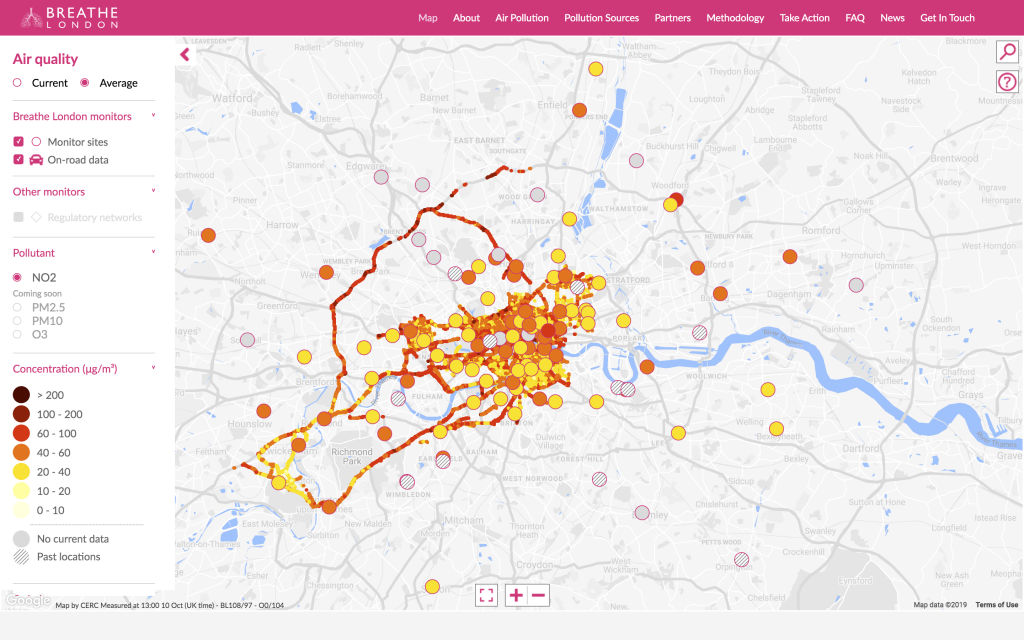
With more than 100 lower-cost sensor pods and specially-equipped Google Street View cars, the pilot complemented and expanded upon London’s existing monitoring networks. The city’s existing regulatory network also provided an excellent opportunity to study the performance of lower-cost sensors and mobile monitoring to determine their reliability and accuracy.

Replicating best practices

Not all cities will have the resources that were available to us in London. That’s why we created the Blueprint guide to share key lessons and help cities replicate best practices, regardless of their starting place or resource level.

We provide guidance to help you get started, including understanding your city’s unique air quality landscape and building your team.

Once you’ve got a better idea of the existing landscape – and you see where data gaps exist – you can set clear goals and design a plan to achieve them.

Achieving your goals

The Breathe London pilot used hyperlocal monitoring to:

  1. Identify pollution hotspots,
  2. Measure the impact of an air quality intervention and
  3. Raise public awareness.

The Blueprint guide explains the approach we took on these three goals and what we found in the process.

Based on what we learned in Breathe London, we include tips for how you can get started on each goal – even if you don’t have as many monitors as we did.

Digging deeper

The Blueprint guide is complemented by the comprehensive technical report, which was written by the entire project consortium and provides a behind-the-scenes look at the practical details and methodology we used.

For anyone interested in digging deeper on the project specifics or the scientific learnings, the technical report is full of detailed scientific information. Topics include quality assurance and control, as well as how the consortium used a novel network-based calibration method.

Looking ahead

We hope the guide provides valuable lessons learned from Breathe London and serves as a blueprint for how to do something similar in your city, regardless of your starting point. Our London insights are already helping our Global Clean Air efforts, such as the work we’re undertaking with Mexico City to scope and shape a hyperlocal monitoring network.

By keeping a spotlight on the threat of air pollution to our health and well-being, data from hyperlocal monitoring is increasingly becoming a viable option to inform better, higher-impact clean air solutions.

To receive news and updates like this, please sign up for our Global Clean Air newsletter.

Image by ZDRAVKO BATALIC.


Posted in Health, London / Comments are closed

Global Clean Air Blog: How increasing data transparency can help reduce pollution

By Millie Chu Baird, Associate Vice President, Office of the Chief Scientist

Harnessing data for good has been at the heart of EDF science for decades. Whether we’re identifying gas leaks underground or methane leaks from the air, we want to use the data we collect and analyze to help the planet and the people who inhabit it. Sometimes, that means turning it over to another organization that can do even more with it.

OpenAQ now features both reference-grade and low-cost sensor data.

One of the keys to fighting air pollution inequity is data transparency—ensuring that as wide a range of people as possible have access to as much of it as possible.

When EDF embarked on our air pollution work several years ago, we partnered with Google, whose Street View Cars drove 23,000 kilometers in Oakland, CA, collecting 3 million unique measurements of black carbon (BC) particles, nitric oxide (NO) and nitrogen dioxide (NO2). This was an astounding dataset at the time, and it took careful analysis and thoughtful work with critical community partners, who helped us better understand the hot spots the data revealed.

Those research partners—the West Oakland Environmental Indicators Project—showed us just how critical getting data into the hands of a robust, engaged community is to turning insights into the kind of action that will improve air pollution, which kills an estimated 6.5 million people every year. They provided essential local insights to help our scientists interpret the data and draw relevant conclusions. This collaboration, built on long-term engagement and trust and a recognition of their role in community organizing in data analysis, was critical to informing policy action. 

Taking advantage of multiple types of pollution and health data and a new legal mandate from the state legislature, the West Oakland Environmental Indicators Project worked with community members and the Bay Area Air Quality Management District to co-create the West Oakland Community Emissions Reduction Plan, turning air pollution data in action.

Merging our data with a robust, community platform

That’s why I’m excited that OpenAQ will be using the datasets we’ve collected and analyzed over the last 5 years. They’ve invested in and continue to build and maintain a robust platform for sharing data from a variety of sources, including government monitors, PurpleAir, HabitatMap and Carnegie Mellon University.

Through workshops in various countries around the world—currently held online—they’ve developed and nurtured a community of researchers and dedicated activists who can access air pollution information in one central location. After all, this air quality sensor revolution is only a revolution if people can see the data. It’s foundational to the ability to take action–whether in West Oakland, California or on the other side of the world.  

This data they present isn’t just for air quality scientists. Their dashboards are accessible enough for those with even a casual interest in air pollution to read and understand. For more technical users, OpenAQ provides an API to pull data for analysis.

As momentum grows to tackle the global air pollution crisis, groups like OpenAQ will be instrumental in helping EDF drive clean air action by shining a light on air quality at a scale and scope never seen before. We hope you’ll spend some time on their platforms, explore the data, and share it with your community. 

Posted in Community Organizer, Oakland, Partners / Comments are closed

Global Clean Air Blog: Houston students thriving during lockdown by learning about air quality


By Shannon Thomas, Project Manager, EDF Environmental Youth Council Program

2019 photo: Houston Environmental Youth Council

Ask parents and educators about the spring 2020 semester, and they’ll likely tell you similar versions of the same story: students were just hitting their strides with various projects and the end of the academic year was in sight. Then it all came to a screeching halt.

The same was true for the students I work with in EDF’s Environmental Youth Council, an educational program for high-school-age youth from communities in Houston that are most affected by high levels of air pollution.

Pasadena Memorial High School teens had learned about the harmful impacts of engine idling as a part of the program. So when a few of our students noticed their classmates leaving their cars running while watching videos on their phones or doing their makeup in the mornings, they were rightfully concerned. They prepared a proposal, went to their principal, and convinced him to adopt a no idling policy in the student parking lot. The students purchased signage and began developing a marketing campaign to support the new policy just as everything shut down.

The signs went into a closet, and I wondered what would become of our program and its 30 students. One of the hallmarks of this program, which started in 2019, has been the creative ways we engage our students. What would happen without the trips to Washington, DC, the hands-on experiments, bus rides to the top of a 200-foot pile of garbage and engaging guest speakers?

Light has a funny way of pushing through darkness, and teenagers can still surprise me.

Growing while meeting virtually

Despite going fully virtual this academic year, we didn’t just keep our Council going; we nearly doubled its size, to 55 students. Teens from Pasadena Memorial, Pasadena High School, and Raul Yzaguirre School for Success in the East End meet online to learn not only about environmental health and science, but also civic leadership, thanks to grant funding from the Gulf Research Program of the National Academy of Sciences, Engineering and Medicine.

By going fully virtual, we’ve actually been able to engage more students. And while the teaching strategies have changed, we’re still able to educate them about the science of air quality and the physical impacts of pollution on the body. 

We’re also hopefully inspiring them to become environmental leaders in their communities, which, due to their proximity to oil and gas refineries, chemical facilities and other industrial sites, are disproportionately impacted by pollution. 

Developing new environmental leaders

One graduate of the program who recently moved away told me she didn’t realize that the odor she smelled every day wasn’t normal. By teaching these students about what’s going on around them and the levers of power that can change it, I hope they’ll develop into leaders who will fight for cleaner air in their communities. 

Houston ship channel

Houston ship channel

So while we haven’t been able to do our boat tour down the Houston Ship Channel this year and won’t be able to visit local Congressional representatives at the U.S. Capitol, I’m excited that such an engaged group of students will emerge from this pandemic with a deeper understanding of the air they breathe and the change they can make. 


Read other Global Clean Air blogs here


Posted in Academic, Health, Houston / Comments are closed

Global Clean Air Blog: How we make pollution more visible

Sarah Vogel headshot

By Sarah Vogel, Ph.D., VP Health

When we’re outside, either walking or driving, we’re instinctively looking out for traffic. “Look both ways when you cross the street,” is advice drummed into most children.

But even so, we all have blind spots, and we’re not aware of the present danger polluting cars and trucks bring into our daily lives.

Our new video shows that although air pollution from vehicle exhaust is invisible, its damage to our health is visible and deadly.


EDF’s Global Clean Air Initiative has spent years researching air pollution in cities around the world. Our pioneering work with Google Earth Outreach, academic, community and government partners in Oakland, Houston and London shows that levels of air pollution vary much more widely than was previously known. In Oakland, we now know that levels of air pollution can vary by up to eight times within one city block. We’ve been working to visualize local pollution and its impacts in order to support targeted policies for cleaner air especially in those communities hardest hit by pollution. But we also recognized the need to make the experience of pollution more visible and more personal to each one of us as we walk down a city street.

Animated Reality Video based on EDF data

We developed a new animated reality video showing the path that pollution takes from tailpipe into the body. Our video was shot in a location in Houston, Texas, in a residential community that lies adjacent to a major freeway where EDF measured high levels of particulates and nitrogen dioxide (NO2) in our 2017-2018 hyperlocal air quality monitoring study, and where the residents experience elevated rates of adult asthma, chronic obstructive pulmonary disease, heart disease, and stroke compared to other neighborhoods in the city.

The video begins with a drone video shot gliding over a busy highway, where the pollution coming from cars and trucks is shown as a half-pipe expanding in 3D. The camera then focuses on a mother and her daughter (both actors) walking down a street–we follow them as they pass trucks and are engulfed in animated pollution particles from exhaust emissions.

Millions of pollution particles in each breath

Pollution is animated as yellow waves of pollution simulating swirling gases, and small, black and yellow animated dots to represent microscopic particles of pollution. According to Adam Nieman of Real World Visuals who worked on this project, a single breath at East Loop South in Houston may contain 18 million particles.1

“The number of particles per breath varies by location and the proximity to different sources of air pollution,” Ramon Alvarez, EDF’s associate chief scientist notes. Regardless of the precise location in an urban area, most people are unaware they can be breathing in millions of pollution particles with each breath.”

Health risks of pollution from transportation

In the video, the animated pollutants travel from tailpipe to trachea, and deep into the young girl’s lungs. EDF epidemiologist Maria Harris shared, “Even short-term exposure to diesel exhaust can cause health impacts, including headaches, dizziness, and eye, nose and throat irritation. Regular exposure to diesel exhaust over time can cause lung cancer, as well as heart disease and other respiratory diseases. Children, whose lungs are still developing, are especially at risk for the respiratory impacts of diesel exposure. Seniors or others with chronic health issues are also at higher risk for respiratory and cardiovascular effects.”

To reduce diesel exposure, Harris suggests trying to limit time walking, biking, or driving on roads with heavy diesel truck or bus traffic, and avoiding areas where diesel trucks or buses idle.

But if we are to build healthy and resilient communities, we need to dramatically cut the emissions from the burning of oil and gas used in transportation, especially cars and trucks.

Benefits for health and climate

In addition to producing harmful air pollution, cars and light trucks account for about 45 percent of all U.S. oil consumption and more than 20 percent of all U.S. greenhouse gas emissions.

Globally, climate emissions from large vehicles are on pace to double in the next 30 years. To reverse this trend and transform large vehicles into a critical part of a 100% clean economy, the global fleet must complete a near-total transition to zero-emission trucks and buses.

Electric trucks can help protect driver’s health

Every day, trucks and buses carry the goods, packages and people that keep our economy running. Usually powered by diesel engines, they are among the dirtiest vehicles on the road.

In the video, the actor portraying a delivery driver is exposed to the invisible pollution. Truck drivers often have high occupational exposure to diesel exhaust, which may put them at elevated risk of lung cancer and cardiovascular and respiratory disease. Cabin air filtration systems can help reduce diesel exposure for truck drivers. But ultimately, the best approach for protecting drivers and the communities they drive through is to shift to electric trucks and buses.

With electric vehicles, a zero-emission future that benefits the environment, people and economy is possible.

Take Action for Healthier Solutions

Now that you’ve seen how dangerous air pollution is to our health, we invite you to join the virtual community assembled at GlobalCleanAir.org and help us bring cleaner air to communities around the world. Also, we hope you join the global conversation about public health and clean air on Twitter @EDFCleanAir.

On the site you’ll learn about the health impacts of different air pollutants, case studies on innovative air quality monitoring across the world, tools to implement community-wide strategies where you live, and tips we can all take to clean the air we breathe. We encourage you to visit, and sign up for our monthly newsletter and advocacy action alerts.

Video Script and Sources

Below are facts cited in the video script, listed with links to their sources.
What if invisible pollution became visible?

1. Around the world, nine out of 10 people breathe unhealthy air. (Source: World Health Organization)
2. FACTOID: Exhaust from [diesel and gasoline] cars and trucks contains pollutants like nitrogen dioxide and particulate matter that can cause heart and lung disease. (Source: US EPA)
3. FACTOID: With every breath, a person on this street will inhale harmful gases and millions of tiny particles. (Source: EDF)
4. FACTOID: Particulates can penetrate deep into the lungs and even enter the bloodstream. Nitrogen dioxide can inflame airways and cause asthma attacks. (Source: American Lung Association)
5. FACTOID: About 4 million children worldwide develop asthma each year from breathing nitrogen dioxide. (Source: George Washington University)
6. Air pollution can cross the placenta and may harm babies’ brain development. (Source: Project TENDR)

Air pollution is invisible, but it damages our health and is sometimes deadly.

Healthier solutions are here.

1.The pollution particle count in the EDF Houston data (near the East Loop South highway) was 36,000 particles per cubic centimeter. The average ‘tidal volume’ of an adult breath is 0.5 litres, which means that a single breath at East Loop South would contain about 18 million pollution particles.

Posted in Climate, Energy, Health, Monitoring / Comments are closed

Pollution data sharing norms are shifting

Sharing code in the tech community hasn’t always been considered a virtue. But GitHub, with its easy interface and mammoth user base, has shown how allowing developers to build on one another’s software code can accelerate innovation of new projects and solve bugs with existing applications, all in a transparent, open-source code hosting platform. The air quality data space is ripe for this kind of move.

Opening access to air quality data

Today, in an effort to address this critical need, Environmental Defense Fund (EDF) is unlocking our new Air Quality Data Commons (AQDC), an open-access data platform where people can share and use data from low-and medium-cost air quality sensors. With the introduction of the AQDC, researchers now have access to more than the 60 million plus data points from EDF and our partners’ air pollution studies in Oakland, Houston and London.

Until recently, few outside of government could afford the expensive, specialized equipment needed to measure air pollution other than well-funded scientists, whose data was typically private until after the publication of a peer-reviewed paper. Even then, when they wanted to share their data with others in the field, they could do so only on an ad-hoc basis with limited infrastructure in place to support such collaboration.

Now, as scientists, cities and residents are taking advantage of new low-cost, high-quality sensors, and the amount of air quality data is growing rapidly, as is the need to store and share it. To unlock the benefits of the data for both scientists and society, it must be open and easily accessible.

The Fourth Wave of Environmental Innovation

Transparency drives innovation

Many of our academic partners have long expressed the desire to share their data — once they’ve had the opportunity to analyze it. However, they’ve lacked a platform that would allow them to do so. Similarly, donors are increasingly demanding that the data gleaned from the projects they’ve funded be available for others to use and explore. By building this community, we hope people will see a benefit to not only accessing available data but sharing their own — they can ask questions of fellow air quality scientists about trends they are seeing and learn from others who may have new was of analyzing existing data.

Our partner Karin Tuxen-Bettman, Program Manager for Google Earth Outreach sees value for cities and Google as well. “By adding to the Air Quality Data Commons, cities can feel confident their investments in air monitoring — whether through a fixed stationary network or city-owned vehicle fleets equipped with sensors — are creating enormous value,” she says. “Validated data shared on the AQDC will contribute to the larger database that Google’s Environmental Insights Explorer will pull from, enabling us to build hyperlocal air quality maps for more cities. By making this data available through a transparent process, the AQDC can accelerate action required to improve air quality.”

We look forward to growing this group of data scientists, companies and cities sharing and analyzing data into a robust community who will contribute to the scientific knowledge base, so we can better understand air pollution problems around the world.

The revolution of smaller, cheaper air pollution sensors has brought us here, but the full potential of this revolution will only be realized when a larger community of scientists, cities, residents and activists use the data we collect to take action and improve local air quality. Join us by downloading our data from the AQDC, or upload your own. We look forward to sharing and learning with you.

We are entering a new era of environmental innovation that is driving better alignment between technology and environmental goals — and results. #FourthWave

This was originally posted on Medium.

Posted in Academic, Monitoring, Partners, Science / Authors: / Comments are closed

Breathe London Data Reveals Big Drops In NO2 Pollution During Commuting Hours

London businesses are starting to reopen and some nonessential workers, who have been working from home, are considering going back into their offices. But what impact might this have on air quality?

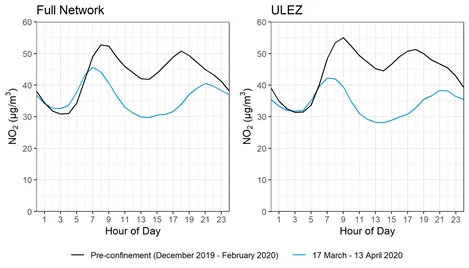
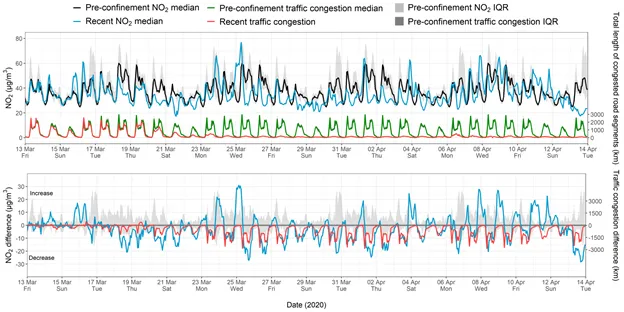
During the lockdown, air quality data from Breathe London shows that harmful nitrogen dioxide (NO2) pollution went down significantly during commute times – 25% in the morning and 34% in the evening.

To help maintain these lower levels of pollution as shops and offices begin to reopen, businesses should allow more flexible ways of working. A new survey confirms it’s what people want.

BL weekday covid

Less pollution during commute times

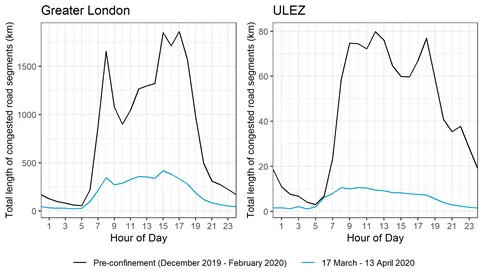
Before the lockdown, many people across the city followed similar schedules on weekdays. As a result, the Breathe London network of air pollution sensors often saw daily dips and peaks of NO2 – a gas produced by fossil-fuel combustion that is associated with heart and lung-related health impacts.

In the pre-lockdown patterns, the lowest levels of this pollution measured was in the wee hours of the morning (around 3-4 am), when most people are sleeping. After they wake up and start moving to school and work, many in their fossil-fuel powered vehicles, the monitors saw a pronounced pollution increase. This falls midday, but pollution rises again in the evening to a second spike as folks return to their homes.

After confinement measures went into place, Breathe London data shows that air pollution significantly decreased across the city, including in residential areas, indicating there have been benefits to Londoners’ health even away from busy roads.

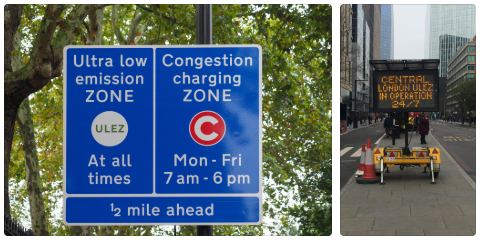
To get a better sense of how lockdown and many people working from home was impacting air quality, we then zoomed in on weekday commuting hours. Across Greater London, NO2 pollution decreased around 25% during the morning commute (8-11am) and 34% in the evening (5-8pm). These pollution reductions were even greater in the city centre, where many businesses are located – 31% and 37% respectively in the Ultra Low Emission Zone.

More work flexibility and clean air action

As lockdown eases, people across the UK want more flexible working options and action to lower air pollution.

That’s the gist of a new survey, commissioned by charity Global Action Plan on behalf of Business Clean Air Taskforce, which finds that:

  • 87% of those currently working from home would like to continue to do so to some degree.
  • 72% of the public believe clean air is more important now because coronavirus can affect people’s lungs.
  • 74% want businesses to do more to improve air quality in the recovery.

Not everyone can work from home, so it’s important businesses provide the option for those who can – leaving the roads and public transport available for essential workers to travel safely.

Build back better

Data helps us understand how pollution changes across the city, and Breathe London data shows the confinement measures have helped lessen the pollution peaks typically associated with commuting.

To protect public health and prevent the return of higher pre-lockdown pollution levels, UK employers should build back better and give people what they want by offering more flexible work options.

For more information on how pollution levels changed since confinement measures went into place, please see the full Breathe London analysis.

This was originally posted to EDF Europe.

Posted in London, Monitoring, UK / Authors: / Comments are closed

How we used machine learning to get better estimate of London’s NO2 pollution reduction

A new analysis for UK Clean Air Day from Environmental Defense Fund Europe (EDF Europe) finds nitrogen dioxide (NO2) pollution was 40% lower than expected across London during the initial COVID-19 lockdown.

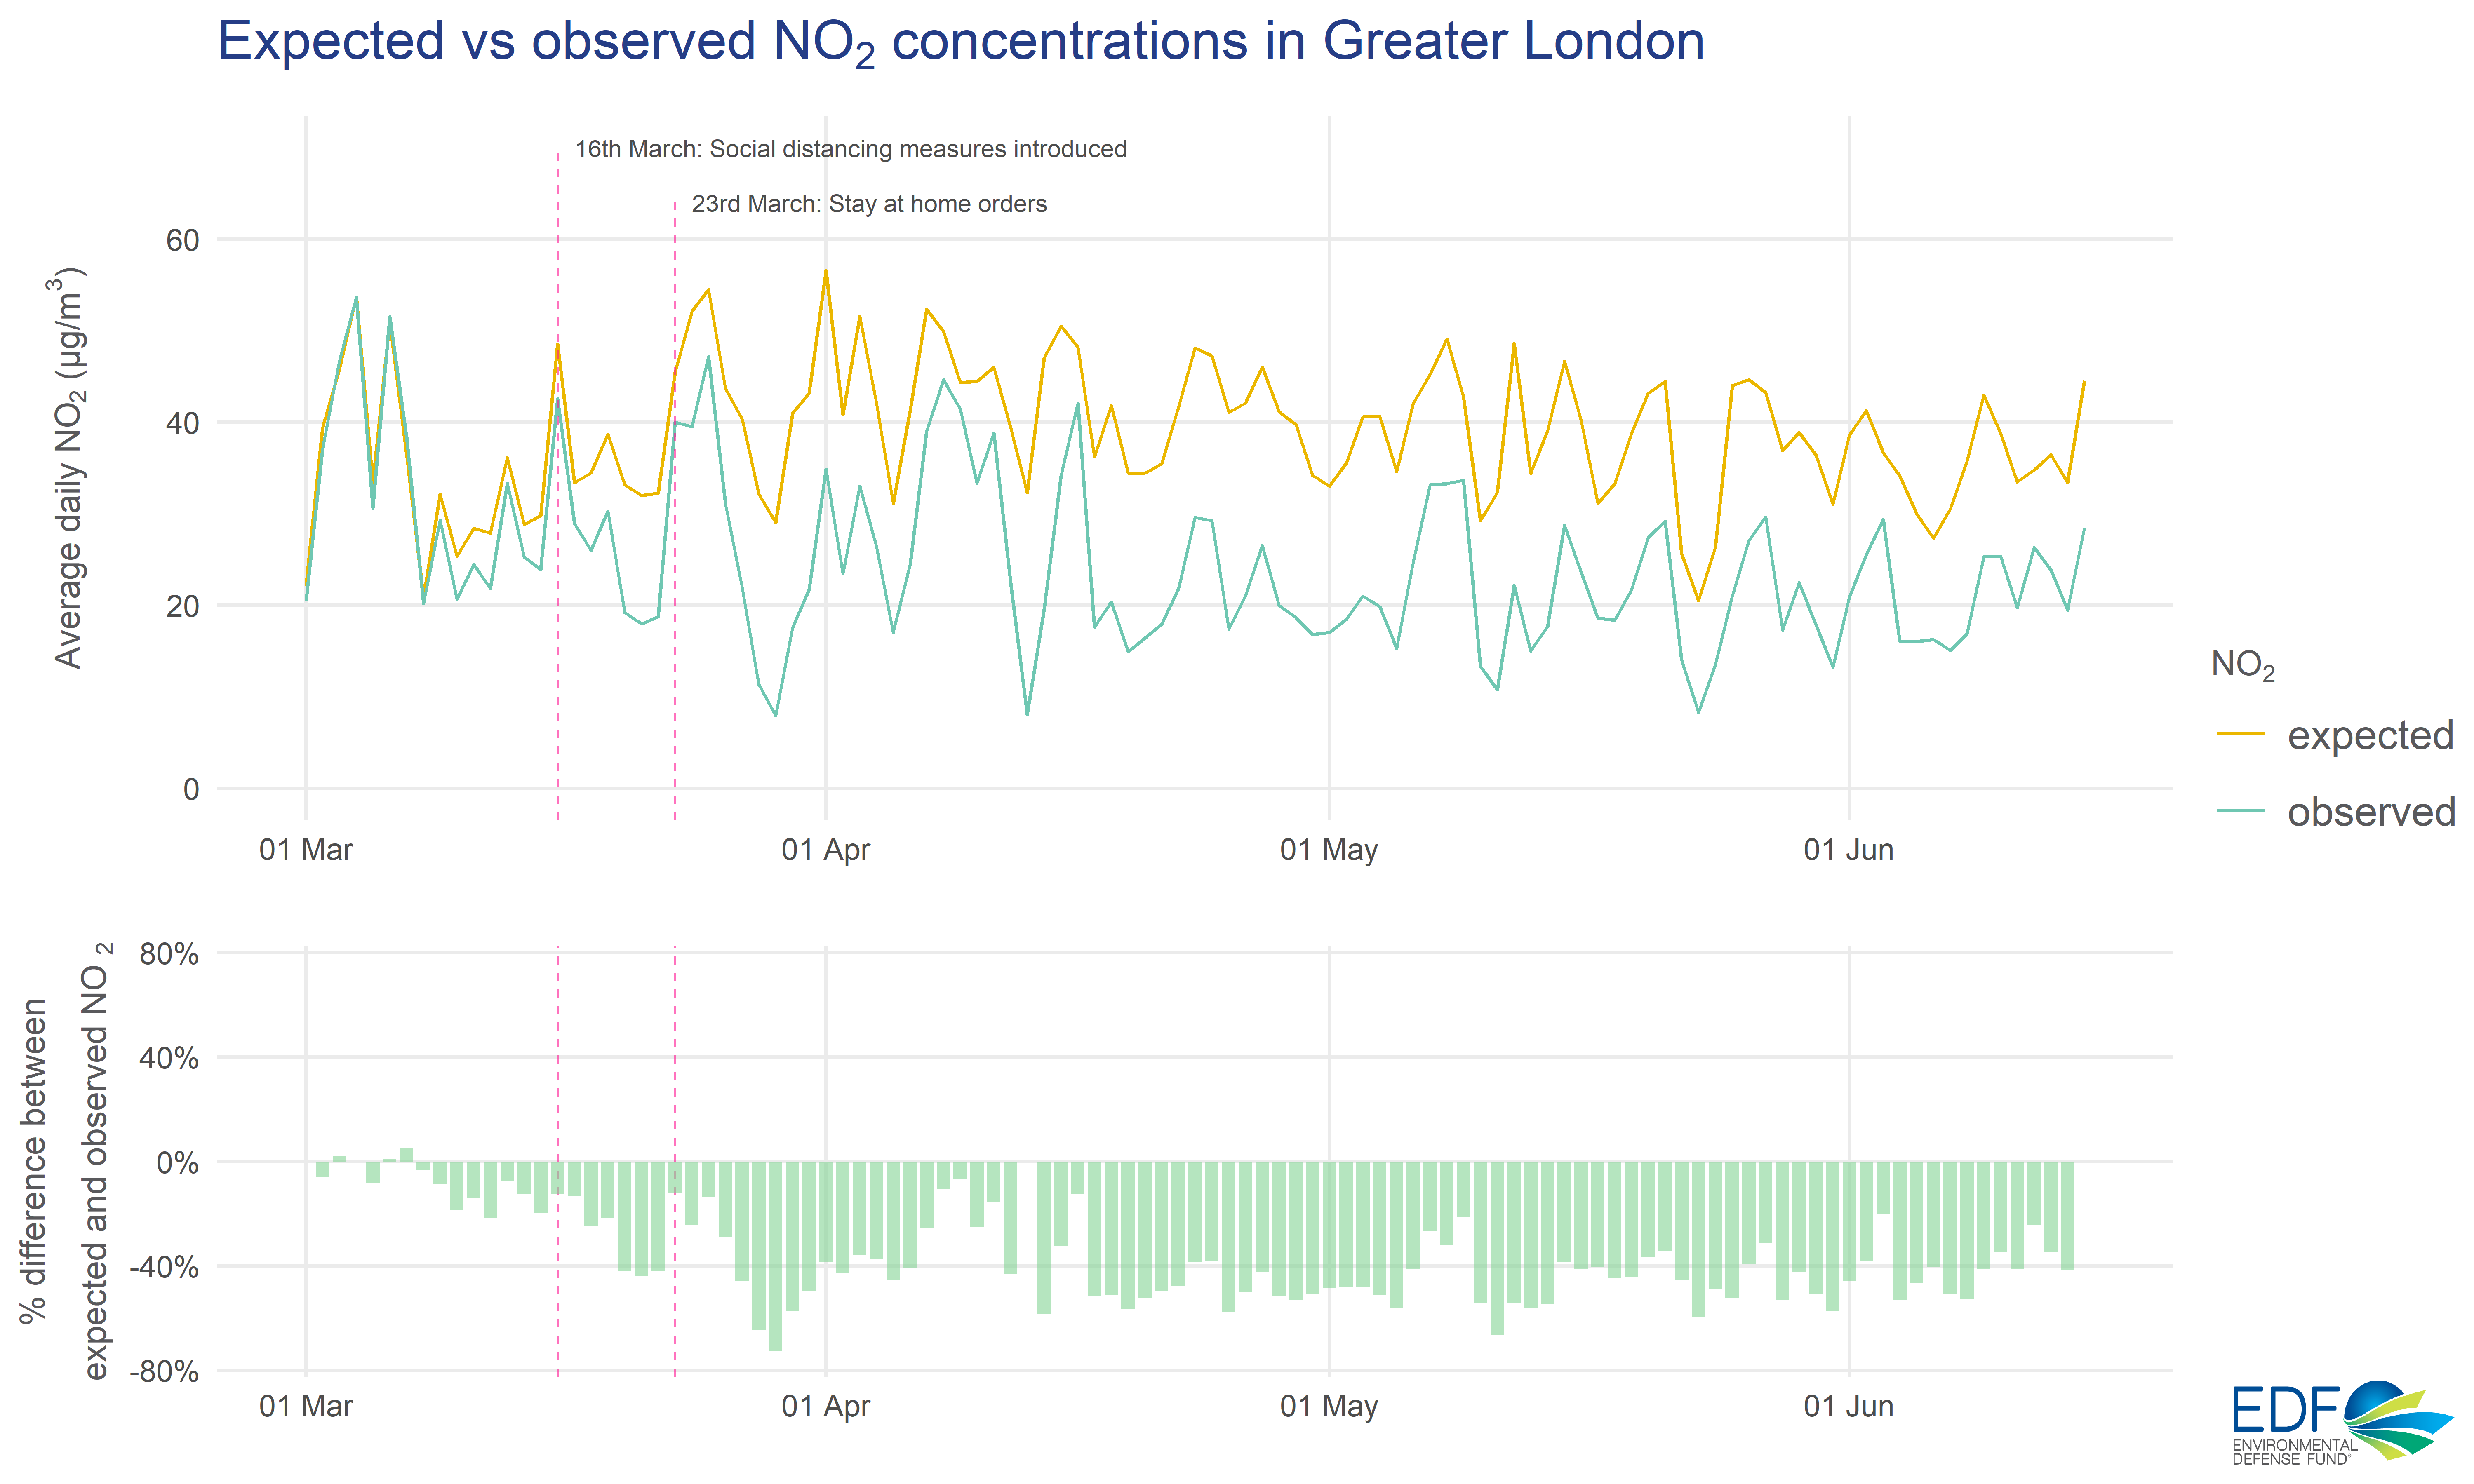
But how do we know about pollution that didn’t happen? We used a machine learning model to predict what the concentration of NO2 would have been if lockdown restrictions had not come into effect. Here’s how it works.

Removing the weather impact

Meteorology and seasonal patterns have a big impact on air quality, which needs to be taken into account when measuring changes in pollution. For example, a windy day could improve air quality by dispersing pollutants that might have otherwise accumulated locally. Meteorological and seasonal variations like this make it difficult to directly compare one period to another – are changes in pollution due to a policy intervention or behaviour change, or is it just the weather?

We wanted to isolate the impact of lockdown measures on London’s NO2 pollution, which is produced from fossil fuels and is associated with heart and lung-related health impacts.

Using open-source tools developed by researchers at the University of York (Grange, 2020), and data from over 100 regulatory air quality monitors, we built a machine learning model to help us do this. London’s long-running monitoring network provides years’ worth of historic pollution data, which is used to train and test the model, alongside a series of meteorological and temporal variables.

We can then use this model – with time and weather information from lockdown dates – to predict the pollution levels we would have expected to see had lockdown measures not occurred. These predictions mirror seasonal and meteorological changes in observed pollution levels much more closely than an historical average, for example, which may vary due to different weather during that period.

As a result, with this method the difference between expected and observed levels can be more directly attributed to the impact of lockdown restrictions rather than random weather variations.
London lockdown expected vs observed chart

40% less pollution

The figure above shows a comparison between average expected and observed NO2 concentrations. The gap between what we expected to see and what we actually saw increases dramatically after 16th March, when social distancing was strongly advised. The figure shows the close alignment of trends between expected and observed levels, illustrating how both are similarly influenced by meteorological effects during the period.

Overall, we found a 40% difference from mid-March to mid-June 2020 – i.e. NO2 pollution levels were 40% less than what the model predicted during lockdown. This is the average change across London’s different monitoring site types, including those close to roads (kerbside and roadside) and farther away from busy streets (urban background and suburban).

Changes in meteorology over time typically complicate air quality intervention analysis, but a machine learning method like this allows us to better isolate changes associated with interventions, like lockdown measures. This method has been used successfully in other recent air quality research – for example, Grange and Carslaw (2019) – and we will continue to use cutting-edge methods like this to better understand how London’s pollution levels are changing.

This analysis complements our previous lockdown assessment using data from the Breathe London monitoring network. We used data from the regulatory monitors here rather than Breathe London because training the model requires a longer historical record.

References:

This was originally posted to EDF Europe.

Posted in Academic, Health, London, Science, UK / Authors: , / Comments are closed

Pandemic exposes need for cities to improve air pollution data collection to protect public health

Harold Rickenbacker, Ph.D., Manager, EDF+Business.

This is the fourth in a series of Global Clean Air blogs on COVID-19 and air pollution. EDF scientists and program experts share data about pollution levels during quarantine from a local and global perspective, and provide recommendations for governments and companies to Rebuild Better.

Los Angeles, California.

Los Angeles, California.

We’ve long known that air pollution is linked to health problems like heart disease and asthma, and that these risks are highest for the elderly and people with existing heart and lung diseases. Now, new evidence shows the same people who have lived with polluted air for decades are also at increased risk for severe illness from Coronavirus.

These findings are generating unprecedented urgency to clean the air we breathe and underscoring the importance for cities across the globe to make air pollution monitoring a priority in a post-pandemic world.

But as local leaders grapple with how to tackle air pollution and protect vulnerable communities, they’re faced with a big challenge: they lack the localized data needed to properly protect public health and reduce harmful emissions.

New, lower-cost sensor technology is allowing scientists, advocates and government officials to map air pollution at the hyperlocal level, which can reveal pollution patterns within neighborhoods and even individual city blocks.

Policymakers tasked with rebuilding healthier and more resilient communities in a post-pandemic world can use localized data to work more effectively with residents and stakeholders to implement powerful interventions that reduce air pollution in overburdened communities.

What better data can tell us

Everyone deserves to breathe clean air, but where you live determines how likely pollution is to worsen or shorten your life. And while most conventional monitoring systems can provide a general sense of a city’s air quality, they can’t account for air pollution at the neighborhood level, where people live, work, and play.

There are two ways local leaders can leverage hyperlocal air quality data to inform solutions for improving community health.

Finding the pollution culprit: Source apportionment

It’s common to see local variations in air pollution concentrations – a spike at one end of the block, but not the other. It’s more difficult, though, to determine the reasons behind that spike.

Through a process called source apportionment, cities can pinpoint the origin of air pollution emissions – using the most sophisticated methods, this information can be obtained at the level of down to a single idling truck, a specific power plant, or even a smoke stack from that plant. This level of specificity can show how individual sources are responsible for fluctuations in air pollution levels, as well as how much impact one sector of sources is having compared to others. For example, is a city’s biggest air pollution problem its diesel trucks or its power generation facilities?

Knowing exactly where pollution is coming from empowers city officials to see how much of their air pollution originates within their city boundaries, versus how much might be coming from a source in the neighboring region. Local governments, such as Salt Lake City are using these insights to identify where they have the authority to implement tailored interventions, or where they can collaborate with neighboring municipalities to clean the air for all.

Understanding the true impact air pollution has on health

person with asthma using an inhaler

The science is clear that air pollution is harmful to human health. Yet, we know little about where and how people are most affected.

Are the higher asthma rates in one neighborhood the result of pollution coming from local truck traffic, and not an upwind power plant? Is your community more or less affected than others in your city and why? Unfortunately, too often we’re seeing it’s low-income and minority populations that are hit the hardest, and tools like Health Impact Assessments (HIAs) are being used to prioritize environmental justice and policy actions.

HIAs were introduced as an independent tool to help practitioners, and decision makers incorporate and weigh public health considerations in decision making. Cities, including New York, London and Barcelona are using HIAs to evaluate what the potential health gains are from adopting various policies. In the Bay Area and in Houston, satellite and sensor data are being used to make the invisible visible.

As local leaders devise solutions for improving air quality, it’s critical that human health is made a top consideration. Making health a factor in the cost benefit analysis will enable cities to show that not only did their policies drive down pollution levels, they too improved public health.

Cleaner skies for a healthier tomorrow

Even in cities that might meet health-based standards, air pollution can burden or even shorten residents’ lives. And it’s disproportionately impacting some communities more than others.

The global pandemic reinforces the need for policies guided by sound science that safeguard our health and climate. At the same time, it’s bringing longtime inequities into sharper focus.

As we look into the future, it’s critical that local leaders harness hyperlocal data to forge evidence-based policies that drastically reduce pollution while building more resilient, inclusive communities.

How cities around the world are responding during the pandemic

Air pollution at some commuter hotspots in London, UK halved in the first four weeks of lockdown, according to new research by our European colleagues. A separate survey showed one in six with lung conditions noticed their conditions were improved during the lockdown. London also temporarily expanded its Congestion Charge to new hours during the evenings and weekends to help reduce traffic pollution. Ultra-low emission vehicles and electric vehicles may drive in Central London without paying the hefty fees.

In Houston, One Breath Partnership is educating residents about environmental racism and the disparities of health impacts of pollution and COVID-19 on Black and Brown communities.

In Beijing, China, local authorities used the biggest political gathering of the year, China’s “Two Sessions,” to set an example and promote cleaner transportation options to the public. During the National People’s Congress (NPC) and the Chinese People’s Political Consultative Conference (CPPCC) in May, NPC and CPPCC representatives from Beijing all used electric vehicles for conference-related transportation. Beijing also has been promoting green transportation through programs such as waiving bike-sharing fees during rush hour and providing additional discounts to frequent bike-sharing users. EDF’s bike-sharing air quality monitoring pilot can help provide supporting data and in turn evaluate the social impact of the city’s approaches to reducing air pollution.

Paris, France is subsidizing purchases of electric bicycles, up to half the cost, or 500 Euros.

Bogotá, Colombia has responded to the pandemic by accelerating existing efforts to encourage low-carbon and cleaner forms of urban transport, such as adding 80 km of ciclovia (bicycle lanes) to the existing 560 km network and making greater provision for pedestrians.

EDF surveyed sustainability leaders across the globe to better understand cities’ unique challenges and opportunities for air pollution management. According to preliminary results, 82% of respondents recognize Health Impact Assessment (HIA) and source apportionment as necessary tools to take action on air pollution. To this point, EDF is interested in learning the current status of air quality in your region, and where you are in your air pollution management journey, including any obstacles and/or successes you’ve faced along the way. Please take 10 minutes to complete this Air Pollution Management Needs Assessment.

This was originally posted to the EDF Health blog.

Posted in Academic, Community Organizer, Concerned Citizen, Government Official/Policymaker, Health, Public Health/Environmental Official / Authors: / Comments are closed