Global Clean Air

Meet Jim Morris, Executive Director and Editor-in-Chief, Public Health Watch

Jim Morris is the Executive Director and Editor-in-Chief of Public Health Watch, a nonpartisan investigative news site focused on the prevention of illness, injury and premature death. Public Health Watch’s coverage of health inequities, environmental injustice and the impact of pollution on communities includes this in-depth look at toxic air pollution in Harris County, Texas

How did you first get interested in public health?

I got into journalism in 1978, and I became interested in the petrochemical industry while working in Galveston, Texas, near the chemical plants and refineries along the Houston Ship Channel. I spent nine years as an investigative projects reporter with the Houston Chronicle in the 1990s, and that’s where I really decided that this should be the focus of my career: toxic exposures in the workplace and communities. 

I felt like most journalists weren’t paying attention to these issues. When something blew up, of course, that was front-page news. But the rest of the time, workers were dying of cancer, community members were dying prematurely, kids had asthma, and nobody was paying attention. People would say, “That’s just the way it is.” I never thought that should be the way it is. Laws are supposed to protect workers and the public.

You launched Public Health Watch last summer, and your series on air pollution in Texas, and specifically this feature on the fight to hold polluters accountable in Harris County, tells a powerful story about the people exposed to the health harms of air pollution. What are you hoping to accomplish with this site?

There are other nonprofit news outlets that are great at what they do, but we want to go much deeper. We’re not going to run away from a 10,000-word story if we think that’s what it takes to get someone engaged in a topic. Especially for something like air pollution–we’re in a good position to connect the dots and go deeper. 

In the Harris County piece, we connected voter suppression with pollution control, when most wouldn’t necessarily make that connection. The ability to choose your local elected officials really can have an impact on things like environmental enforcement. It’s a cliché, but it’s about trying to go much deeper than the usual “this happened yesterday.”

We’re going to stay focused on this topic of Texas air pollution at least for the rest of this year. We have four to six substantial investigative pieces in the works. This doesn’t include shorter, newsier pieces.  

What role can investigative journalism play in bringing about change for communities most impacted by air pollution?

Well, with this story, we don’t know yet. But just looking at social media–the story was being shared and liked by people we had never heard of before. People from all over the world. It was pretty remarkable and indicated to us that we had struck a nerve or done something beyond the ordinary. And a Texas state representative from Houston said she was “deeply disturbed” by our findings and would propose legislation next year to crack down on polluters.

We’re not expecting miracles here. Rarely do you see immediate impact; I’ve done projects where I’ve found out years later that something I wrote led to a policy change. The more of these stories we do, however, the greater the chances of impact.

What gives you hope?

People like [Harris County Attorney] Christian Menefee and [Harris County Judge] Lina Hidalgo–young elected officials of color who genuinely care about the people in fenceline communities. They’re doing what they can to crack down on chronic air pollution. Those two are genuinely inspiring. If you get enough people like them holding local and, ultimately, state office, that’s when you’ll see real change.

Posted in Environmental Justice, Health, Houston, Partners, Science, USA / Comments are closed

Stronger national fine particle air pollution standards will provide significant health benefits and reduce disparities

This blog is co-authored by Taylor Bacon, Analyst, US Clean Air and Climate; Maria Harris, Senior Scientist; and Mindi DePaola, Program Manager, Office of the Chief Scientist.

A new EDF report finds that strengthening federal protections for fine particle air pollution (PM2.5) to 8 µg/m3 will have large health benefits and reduce air pollution-related health disparities in Black, Hispanic and low-income communities across the United States. That’s because these communities bear the brunt of harm from the nation’s most pervasive and deadly air pollutant.

The report comes as the U.S. Environmental Protection Agency, under President Biden, is reviewing the National Ambient Air Quality Standards for fine particle pollution (PM2.5). The agency is expected to propose a new standard this summer.

Wide disparities in exposure and health effects of air pollution

The analysis by Industrial Economics, Inc. finds that in 2015, PM2.5 resulted in 120,000 premature deaths and 75,000 respiratory emergency room visits. Children and older adults are particularly vulnerable.

Disparities in exposure and resulting health outcomes were substantial across the U.S.:

  • Black, Asian and Hispanic Americans had greater likelihood (84%, 58%, and 113% higher, respectively) than others of living in neighborhoods where air pollution levels were above 10 µg/m3
  • Black Americans over age 65 were three times more likely to die from exposure to particulate matter than others.
  • People of color were six times more likely to visit the emergency room for air pollution-triggered childhood asthma than white people.

For decades, communities of color and low wealth have been targeted for environmental hazards that others did not want: power plants, landfills, shipping ports, freeways and factories. The resulting inequities in pollution exposure are further aggravated by longstanding discriminatory disinvestment, poor housing, limited health care, educational and economic opportunities perpetuating health disparities, intergenerational poverty and higher vulnerability to health impacts of air pollution.

The report shines a light on what communities exposed to particle pollution everyday already know: they’re surrounded by pollution sources that are harming their health and shortening lives. 

EPA can set protective standards which will provide health benefits and reduce disparities

In 2020, the Trump administration retained the existing standard for PM2.5 of 12 µg/m3, ignoring a large and growing body of scientific evidence indicating that this standard was not adequate to protect public health. Environmental and health groups petitioned EPA to reconsider this decision, and in the fall of 2021, EPA launched a review of the PM2.5 standards. As part of this review, EPA took stock of the new science since the last review and considered the policy implications of this new research. In their policy assessment, EPA found strong evidence that the current annual standard of 12 µg/m3 does not adequately protect human health and considered alternate standards between 8 and 11 ug/m3. The Clean Air Scientific Advisory Committee (CASAC), a panel of independent scientists convened to advise EPA, recommended a range of 8-10 µg/m3 for the annual standard.

EDF’s report builds on EPA’s analysis of racial and ethnic disparities in pollution exposure and health impacts under the current and alternative standards, and it supplements EPA’s policy assessment by addressing some of the suggestions made by CASAC for future reviews, including greater attention to risk disparities, expanding the geographic scope of the analysis and considering current PM2.5 levels in estimating the benefit of alternative standards.

The report supports both EPA’s and CASAC’s conclusions that the current standard is not adequate to protect health and finds significantly larger benefits of an 8 μg/m3 annual standard over 10 μg/m3

  • Nationally, a standard of 8 µg/m3 would have 3.5 times greater health benefits than a standard of 10 µg/m3 (16,000 premature deaths and 10,000 respiratory emergency room visits avoided at 8 µg/m3 vs. 4,600 premature deaths and 3,000 respiratory emergency room visits avoided at 10 µg/m3).
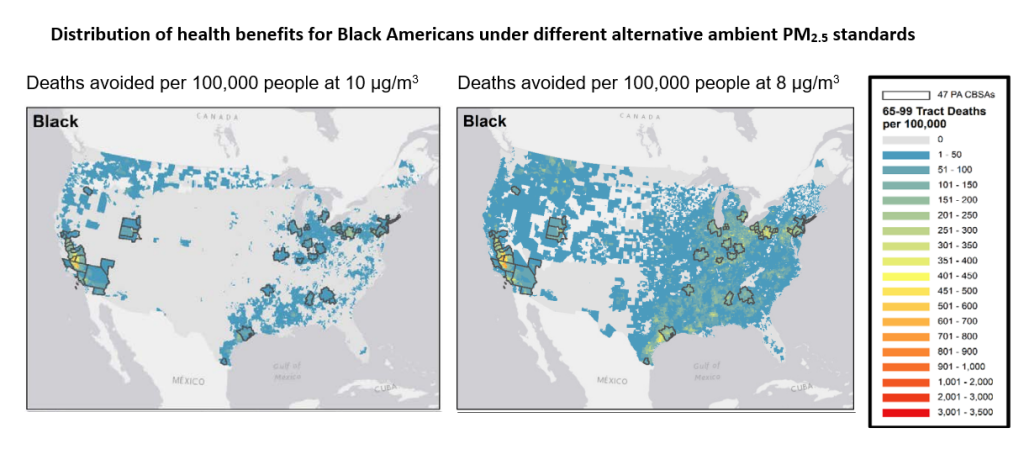
  • A standard of 8 µg/m3 would go further to reduce inequities in the health burden of air pollution than a standard of 10 µg/m3, particularly between Black and white populations. People experiencing poverty would see 30% higher benefits in terms of reduced mortality compared to higher income communities.

As seen in the figure above, even with strengthened standards, substantial disparities in the health impact of particulate pollution would persist. It is essential that EPA also takes complementary actions that directly tackle environmental injustice.

Fine scale data offers insights on disparities

In their policy analysis of alternative standards, EPA utilized regulatory monitor data and modeling at a scale of 12 km2 to determine exposures to air pollution and benefits of alternate standards in 47 major metropolitan areas. However, outside of cities, there are few regulatory monitors and limited modeling to provide air quality information.

To better understand current PM2.5 exposures and potential health benefits of a stronger pollution limit for every community, we utilized fine scale satellite, land use and emissions-based data that offer a clearer picture of air pollution. We found significant health impacts of PM2.5 not reflected in EPA’s analysis of 47 metro areas: PM2.5 causes an additional 83,000 premature deaths and 49,000 emergency room visits for respiratory diseases. Black people and people experiencing poverty bear a higher burden of air pollution health impacts with similar disparities in both urban and rural areas.

Nearly 40 percent of the lives saved from a stronger standard of 8µg/m3 are outside of the areas evaluated by EPA. Critically, our report finds that communities outside of EPA’s analysis would see limited annual benefits of an alternative standard of 10 µg/m3–420 lives saved–but significant benefits of a standard of 8µg/m3–5,800 lives saved.

The pollution data forming the basis of this analysis have been evaluated using monitoring data, and thus in areas where there is limited monitoring there is lower certainty in the levels estimated (like large areas outside of those evaluated by the EPA). This makes clear the implications of blind spots in air pollution monitoring. Our report indicates a substantial health burden of air pollution in these areas and large benefits from a strong standard of 8µg/m3. This can, however, only be validated and enforced by expansion of regulatory monitoring in these areas.

We have an opportunity to act now

EPA is expected to propose a new standard this summer and will take comments from the public at that time. It is imperative that the proposed standard reflects both EPA’s and the Biden administration’s commitment to environmental justice in that it adequately protects the people at greatest risk. This report shows that strengthening the National Annual Ambient Air Quality Standard for PM2.5 from 12µg/m3 to 8µg/m3 would go the furthest towards reducing this disproportionate burden of air pollution and is a critical immediate step. 

Editor’s note: This blog was updated on March 23, 2023 to reflect findings from an updated version of the original analysis.

Posted in Academic, Environmental Justice, Government Official/Policymaker, Health, Public Health/Environmental Official, USA / Comments are closed

Introducing Air Tracker: A backward take on air quality to pinpoint sources

EDF’s new Air Tracker tool allows us to better understand how local air pollution behaves, illuminating the path it takes from a likely source area. Because this tool allows us to look backwards at where pollution likely originated, it shifts the focus, putting communities and people first. Developing it required a shift in thinking. 

Most atmospheric scientists focus on particle and air movement to help us predict what’s going to happen in the future. As a scientist working in air pollution, I wanted to use those same principles to look backwards so I could better understand how the emissions upwind of us mix and travel through the air, providing a better picture of what we’re breathing at any given time. This way, we don’t have to model every single source to know what’s important to who and when.

When I joined EDF in 2019, our scientists had already successfully shown how mobile air monitoring programs could highlight dramatic differences in pollution levels within individual city blocks. We wanted to go beyond showing the presence of pollution–and illustrate how it traveled to get there. 


EDF and academia joined forces to leverage cutting edge insights.

To do this, we enlisted the help of John C. Lin, an atmospheric scientist from the University of Utah who developed the STILT model (which has since been incorporated into NOAA’s HYSPLIT model). He and his team were already working with our partners at Google Earth Outreach on a source apportionment project. We also tapped Paul Dille (who pulled in Randy Sargent and Amy Gottsegen) from CREATE Lab at Carnegie Mellon University, whose Smell PGH application allows users to better understand the pollution landscape in Allegheny County, PA. EDF colleagues Alex Franco, Mindi DePaola and Grace Tee Lewis provided invaluable insight and help as well.

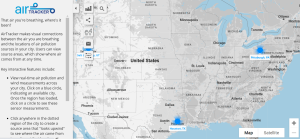
Air Tracker runs on  real-time, trusted, scientific models coupled with air pollution and weather data to help residents, scientists and cities learn more about the air they’re breathing. While Air Tracker is currently mapping fine particle pollution trajectories in Houston, Salt Lake City and Pittsburgh, we designed it to work with other primary pollutants anywhere in the world. 

Air Tracker allows users to trace the path of likely sources of air pollution in Houston, Pittsburgh and Salt Lake City.

Filling current air monitoring gaps

Despite advances in low-cost mobile and stationary monitoring networks, existing air pollution tracking is still lacking. Currently designed to provide us with a solid understanding of background air pollution, the federal and state government  system of monitors essentially smudges out the rough edges to create averages, which underemphasizes the very real, very harmful pollution burden many urban–often historically vulnerable–communities face. 

Air Tracker can help counter that averaging effect. It allows users to click anywhere within their city map to see the most likely source area of the air they’re breathing at any given time. 

Beyond the mapping application, it can improve air quality efforts in the following ways:


  • Placement of new monitors and networks

For communities that have long suspected they’ve been subjected to dirty air, Air Tracker can help them show that their air is influenced by nearby facilities. This can help them place monitors in specific locations to show just how much pollution they face and when it’s at its worst. 

Cities wanting to get serious about air quality can also use the tool to design either stationary or mobile monitoring efforts. It can also help them answer questions about specific facilities that are known emitters, while spotting ones that may not have been on their radar.  

  • Hold polluters accountable 

Even in cities like Houston–where a lack of zoning has allowed industry to flourish unchecked, putting homes, schools and entire communities in the path of harmful pollution–it can be hard to pinpoint which facilities are most likely responsible for localized emissions. The models behind AIr Tracker’s source area development use wind and weather data to illuminate which pollution sources are the most likely culprits, giving regulators a powerful enforcement tool.   

  • Putting communities and people first

Because Air Tracker can look backwards at pollution’s path, we can start with communities and people first when seeking to map exposure and its impacts. This can help correct for the current distortion of our current air pollution monitoring system, which wrongly assumes all people are exposed equally.  

We know communities face an unequal burden from air pollution. Our hope is that Air Tracker will allow us to better capture and highlight those discrepancies so the people living there can get the relief they need and deserve. Read more about the methodology here.


Posted in Academic, Community Organizer, Concerned Citizen, Homepage, Houston, Salt Lake City, Science / Comments are closed

Meet Jennifer Hadayia, Executive Director, Air Alliance Houston

Jennifer Hadayia is the Executive Director of Air Alliance Houston, a nonprofit advocacy organization working to reduce the public health impacts from air pollution and advance environmental justice. With nearly 25 years of public health experience, Jennifer leads AAH’s mission and strategies, which include equity-centered research, community-based education and collaborative advocacy.  


How did you first get interested in the public health impacts of air pollution?  

I have worked in public health for close to 25 years, and most of that time has been at state and local health departments where I oversaw prevention-focused programs on infectious diseases, chronic disease, and even maternal and child health. I spent a lot of time reading and researching and trying to understand how to help people prevent poor health outcomes.  

Even 25 years later, I still remember the day when my eyes were first opened. I was reading a report from the Institute for Health Metrics and Evaluation, which explained that the number of heart attacks in a community could be predicted by the level of PM2.5 in the air. The impact of air quality on public health was mind-blowing! After years of trying to change individual behavior, it was clear that improving environmental conditions could have a far greater impact on people’s health at a population level.  

Tell us about Air Alliance Houston’s work. 

Air Alliance Houston was formed in the late 1980s as a merger between two groups of residents and parents concerned about smog. We’ve undergone some key evolutions and expansions in the last 30 years to embrace a population health perspective and a focus on environmental justice. Today our mission is to reduce the public health impact of air pollution through research, education, and advocacy.  

We run several campaigns on specific air pollution issues and solutions such as problematic air permits, transportation planning that de-prioritizes Single Occupancy Vehicles (SOVs), connecting air pollution to climate action and community-level air monitoring. But it’s our approach to the work that I think makes us unique: 

  • We inform the narrative about public health and air pollution through an environmental justice lens by uplifting community voices and experiences through participatory research and planning.  
  • We work to build community knowledge and power through the diffusion of accurate information about air pollution, its sources, and how environmental decisions are made in Texas. 
  • We create pathways for impacted and overburdened residents to engage in environmental decision-making and become advocates for their health. 

Is there an upcoming project or initiative that Air Alliance Houston is working on that you’re especially excited about? 

Yes! We’re planning to unveil two new initiatives this year that build on our past advocacy successes, so we can scale our impact even further.  

The first is called AirMail, which is an enterprise mapping system that scrubs air permit applications to the Texas Commission on Environmental Quality (TCEQ) for “bad actors” in Houston’s environmental justice neighborhoods. It then maps the facilities to a public web-based platform and notifies impacted residents via postcard. The map and the postcards explain the air quality impact of the permit (for example, a refinery expansion or a new residential concrete batch plant) and provide actions that residents can take, including connecting to our second new initiative, the Environmental Justice Leadership Lab (EJLL).  

The EJLL is a consolidation of the various training and technical assistance options we provide to community members, so they have the tools and knowledge that they need to speak out against a problematic permit or engage in other environmental decision-making.  

Both of these initiatives have been in the “proof-of-concept” phase, requiring extensive manual time and effort. With the automation of AirMail and the consolidation of our training and technical assistance resources under the EJLL-branded umbrella, we will be able to oppose even more polluters and to empower even more residents.  

Why is clean air important to you personally? 

I was born and raised in Houston. My father and grandfather were dock workers at the Port of Houston, surrounded every day by oil refineries, chemical facilities, tankers and trucks. Growing up, I remember that my father never left the house for work without two things: his cowboy boots and his asthma inhaler. He had debilitating asthma his entire life, and he died young, as did my grandfather, after many years of cancer and heart failure. I don’t think either of them or our family ever made the connection between where they worked and were exposed to poor air quality every day and their poor health and early death.  

Knowing what I do now about air quality and health, I have little doubt there was a connection. I’m deeply proud that I now have the opportunity to work to improve health conditions for Ship Channel families like my own, and to do so with the talented and dedicated staff of clean air advocates at AAH.  

Posted in Environmental Justice, Health, Homepage, Houston, Monitoring, Partners, USA / Comments are closed

Houston may exceed national standards for harmful fine particulate matter, new monitoring shows

Big Gaps in Air Monitoring 

Air quality in the U.S. has improved tremendously over the last 50 years thanks to the Clean Air Act Amendments of 1970, but not all neighborhoods have benefited from these improvements. The law mandated the Environmental Protection Agency (EPA) to establish National Ambient Air Quality Standards (NAAQS) and to determine which areas of the country meet the standards and which do not, setting the foundation for air quality management in the U.S. 

Air quality management agencies and EPA rely on data from regulatory monitoring networks that exist across the country. However, these monitoring networks are designed to give region-wide pollution averages, and monitors are often sparsely located. For the 25 largest U.S. urban areas with continuous regulatory monitoring, there are an average of only 2 to 5 monitors per million people. Some of these monitors are intentionally sited away from emissions sources to capture background pollution levels; the trade-off is that they can miss critical pollution hotspots, especially near major sources of pollution. 

This is exactly what happens in Houston, TX. High levels of harmful particulate matter (PM2.5) have for far too long gone undetected. One such area is the Settegast neighborhood, northeast of downtown Houston, where community members have long voiced concern about air pollution from a nearby railyard, concrete batch plants and metal recyclers. Finally, in 2019, the Texas Commission on Environmental Quality (TCEQ) recommended adding a PM2.5 continuous monitor to the Settegast neighborhood at a site on North Wayside Drive to “improve population exposure coverage,” which EPA approved in the same year. At last, the monitor was deployed in May 2021.

Risk of Nonattainment in Houston

Since the deployment, the new monitor has consistently shown some of the highest PM2.5 levels in the Houston-Galveston-Brazoria (HGB) region. The average PM2.5 concentration over the past 11 months exceeds the current annual NAAQS threshold of 12µg/m3, threatening to push the region into nonattainment status for this pollutant. (Table below shows mean concentration = 12.3µg/m3 from May 3, 2021 to March 10, 2022) 

Annual Average PM2.5 Concentrations at Wayside, as of March 20, 2022. Source: https://www.tceq.texas.gov/cgi-bin/compliance/monops/24hr_annual.pl

The review process currently underway at EPA to reexamine the NAAQS for particulate matter is expected to result in stronger, more health-protective thresholds. It is expected that EPA will make the final ruling on PM NAAQS in Spring 2023, which will trigger a designation process for many areas of the country. A more health-protective standard will make it more difficult for the HGB region to remain in attainment unless actions are taken now to reduce emissions.

A nonattainment designation is costly for a region, both in terms of direct costs of pollution controls and the potential larger economic losses from lower business activities and lost investment opportunities. One analysis estimates that exposure to particle pollution in the nine-county metropolitan Houston area contributed to more than 5,000 premature deaths in 2015 and nearly $50 billion in economic damages.

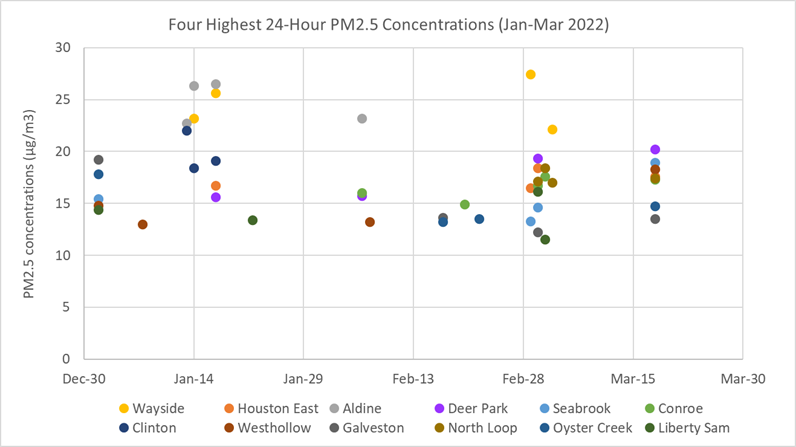
In addition to the annual trend, the Wayside monitor also shows high short-term spikes in PM2.5 concentrations. So far in 2022, the four peak days of PM2.5 concentrations at this monitor are some of the highest in the HGB region, with peak 24-hour concentrations ranging from 22 to 27µg/m3. (See diagram below. Wayside measurements are shown in yellow dots.)

Four Highest 24-Hour PM2.5 Concentrations in 2022 as of March 20, 2022. Source: https://www.tceq.texas.gov/cgi-bin/compliance/monops/pm25_24hr_4highest.pl

Where Is Pollution Coming From?

The Wayside monitor sits ~700ft east of the Union Pacific railyard. Traditionally, railyards and the associated locomotives and drayage truck activity are a major source of particulate matter. Other emission sources adjacent to the site include a metal recycler, a concrete batch plant and several nearby truck yards. Flanked between the railyard and North Wayside Drive is a community that includes a large apartment village, a retirement home, a high school and churches. This railyard is also known to have used creosote to preserve wooden ties, which created an underground contaminated plume that has drifted beneath people’s homes.

EDF and partners are developing a tool that would allow us to investigate the sources of emissions that are measured by regulatory monitors like the one on North Wayside. Early data shows high pollution readings that can be traced to multiple industrial locations in that area. Data also shows that on three of the four highest readings in 2022, the source area is to the west of the monitor around the UP railyard. 

What Should We Do?

It behooves the region to come together now to address this issue before a nonattainment designation is made. EDF and others are reaching out to TCEQ, the Houston-Galveston Area Council, industry groups and community organizations to identify best-management practices that could be deployed to help reduce the elevated PM2.5 emissions.

At the request of EDF and community groups, TCEQ now plans to install a speciation monitor at Wayside to better evaluate the sources on an ongoing basis. While a more thorough analysis is needed to reach any conclusions about potential sources, there are near-term actions that can be taken to protect communities’ health and to prevent Houston from exceeding the NAAQS threshold. 

  • TCEQ should be requiring the railyard, local metal recycling and concrete plants to adopt best management practices. For instance, requiring anti-idling devices be installed on locomotives and upgrading to cleaner engines could significantly reduce emissions at the Union Pacific railyard.
  • Increasing anti-idling enforcement on main truck routes and around truck-attracting facilities can also lower truck emissions in the near-term.
  • TCEQ could also require industrial facilities such as metal recyclers to adopt best practices to minimize both primary and fugitive emissions, including adoption of abatement and control equipment.
  • There is a need and opportunity for broad adoption of zero-emission equipment which is readily available and affordable, as costs have come down significantly in the last few years.  

EDF will continue to facilitate discussions among stakeholders on this issue and support efforts to minimize pollution and help position Houston to meet the current–and future–national air standard to protect people’s health.


Posted in Concerned Citizen, Health, Houston, Monitoring, Public Health/Environmental Official, Science, Texas, USA / Comments are closed

Traffic-related air pollution results in new childhood asthma. The actions we take today matter.

Asthma changes the physical, emotional and academic trajectory of a child’s life. More than 5 million children in the United States have asthma, and every year there are over 750,000 emergency room visits and over 74,000 hospitalizations for asthma among children. Asthma is the leading cause of missed school days each year, and it has been linked to diminished school performance. Although ambient air pollution exposure has long been associated with the worsening of asthma symptoms, mounting evidence indicates that it also leads to the development of asthma among children

A recent study found that annually nearly 2 million children worldwide develop asthma due to exposure to nitrogen dioxide (NO2), a traffic-related air pollutant. Transportation is a key driver of this pollution. Freight trucks and buses make up less than 10% of the vehicles on U.S. roads, but they are responsible for half of the transportation sector’s nitrogen oxide emissions. In some urban areas, 1 in 5 new childhood asthma cases are due to exposure to nitrogen dioxide; in particular neighborhoods, this risk can be twice as high

How NO2 causes asthma

Studies exploring how NO2 affects the lungs indicate that repeated or long term exposure results in activation of biological pathways that contribute to the development of asthma: secretion of inflammatory cytokines, altered cellular structure, oxidative stress, allergic sensitization, increased mucus formation, airway remodeling and airway hyperresponsiveness. Studies of NO2 exposure to human bronchial epithelial cells find an increase in pro-inflammatory mediators and inflammation involved in the pathology of asthma.

A growing body of evidence describes the impact of NO2 on new cases of childhood asthma. It shows consistent and reproducible effects across different cities and populations in North America. Below are a few:

  • In studies of Latino and African American children across Chicago, Bronx, Houston, San Francisco and Puerto Rico, a higher average NO2 exposure during the first year of life was associated with higher odds of being diagnosed with asthma. This was also seen in another study of children in East Boston, Massachusetts.
  • Among 1.2 million children in Quebec, scientists found that higher childhood exposures to NO2 levels at their residential address were linked to increased risk of asthma development.
  • A recent study of 4,140 elementary school children (with no history of asthma) in southern California provides particularly strong evidence.  Scientists found that a drop in nitrogen dioxide, over a period of air pollution decline, was associated with a reduction in asthma incidence. This finding was reinforced when using cutting edge causal methods, which found that “childhood asthma incidence rates would have been significantly higher had the observed reduction in ambient NO2 in southern California not occurred in the 1990s and early 2000s, and asthma incidence rates would have been significantly lower had NO2 been lower than what it was observed to be.”

These are just a few of the studies that have been done in North America. A systematic review and meta-analysis of 41 studies from around the world investigated the impact of different air pollutants on asthma incidence among children. Of these, 20 studies directly assessed the impact of NO2, and found that a small increase (4 µg/m3) in NO2 exposure led to a 5% increase in the risk of developing childhood asthma.

Across these studies, scientists took pains to ensure the findings were not due to other factors like age, sex, race-ethnicity, poverty or smoking in the household. 

We have an opportunity to protect our children’s health

We have an opportunity to protect our children by identifying communities overburdened by NO2 pollution and its sources. 

First, we need to end the blindspots on NO2. We must make the true cost of diesel clear through investments in transparency and accountability. New satellite data and community monitoring can help identify pollution hotspots. Robust funding for NO2 monitoring, analysis and enforcement will enhance existing data to support protective action. The US EPA’s $20 million in grant funding for increased air quality monitoring in communities overburdened by pollution is an important step in this direction.

Better emissions inventories–especially around areas of high truck traffic like ports and warehouses–are important to further illuminate sources and target solutions.

Finally, eliminating harmful pollution from diesel vehicles is crucial. Transitioning to electric school buses, cars and trucks is feasible. New research from EDF finds that by 2027, electric freight trucks and buses will be cheaper to purchase and operate than their combustion engine counterparts. EPA recently proposed stronger pollution standards for medium- and heavy-duty freight trucks and buses, but it needs to go much further in leveraging zero-emitting solutions. Bold clean energy investments by Congress would provide credits to people who purchase electric vehicles, support development of additional charging infrastructure and increase air quality monitoring to ensure that NO2 doesn’t linger in frontline communities.

We must act now to reduce NO2 pollution and prevent more asthma every year. The status quo is clearly unacceptable for our children.

Posted in Health, Homepage, Science / Comments are closed

Making the most of sensor data: How tracking performance of lower-cost sensors allows cities to reveal actionable insights about local air pollution

Lower-cost air quality sensors can be a game changer for cities looking to understand and improve air quality at the neighborhood level. However, issues with accuracy have been a key barrier to their adoption. Our new paper shows how users can make the most of their data by evaluating sensor performance on a continuous basis.

Collocating sensors to track performance

As part of the Breathe London consortium, we installed 100 sensor devices across the city  to measure key pollutants including nitrogen dioxide (NO2) and particulate matter for more than two years. Lower-cost sensors like the ones we installed are more sensitive than reference-grade instruments to environmental factors like temperature, relative humidity, or even levels of other pollutants. That can make their measurements less reliable in some environments, or even in certain seasons of the year.

To make sure our data was both accurate and useful, the Breathe London consortium developed rigorous quality assurance procedures. For our NO2 dataset, the procedures included multiple methods to calibrate the sensors, as well as applying an algorithm to correct for sensitivity to ozone, which the sensor can mistake for NO2.

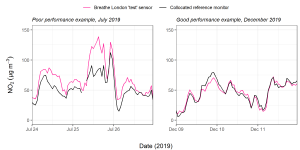
While most of our sensors were collecting measurements at new locations across Greater London, we also installed two “test” sensors alongside London reference-grade monitors for most of the project. By tracking when data from these “test” sensors deviated from the more expensive reference instruments, we had an indication of how sensors across our network were performing at different times.

In the left panel, the “test” sensor measurements show a large deviation from the collocated reference monitor (right), indicating a period when the sensor was not performing well.

This approach provided a reality check for our pollution data. If the sensor network reported high NO2 values but the “test” sensors were completely off track from the reference at that time, we could infer that the network result may have been affected by poor sensor performance and adjust accordingly. This kind of ongoing sensor evaluation is important. Without it, users could mistake erroneous sensor data as evidence of major pollution events or local hotspots.

Why performance matters

Our NO2 sensors performed well most of the time, producing data that revealed a variety of actionable insights, including:

  • Times of day and days of week with the highest pollution levels
  • Regional pollution episodes (for example, a multi-day period with high pollution caused by weather conditions)
  • Hotspot detection
  • Impacts of sources on pollution patterns at different locations
  • Long-term trends (for example, seasonal changes or year-over-year improvements)

Improving our understanding of air pollution in cities around the world

While the uncertainties associated with lower-cost sensors may make them unsuitable for some applications, our project demonstrates a way to generate actionable insights from sensors. The Breathe London network’s NO2 data shows that with rigorous quality assurance and ongoing evaluation of sensor performance, cities can utilize lower-cost sensors to better understand local air pollution. That can allow more communities to take advantage of this relatively new technology, even if they do not have the resources to purchase a network of more costly  reference-grade monitors.

Posted in Academic, London, Monitoring, Science / Comments are closed

Meet Ethan McMahon, Chief of Party, Clean Air Catalyst

Ethan McMahon is the new Chief of Party for the Clean Air Catalyst, a flagship program launched by the U.S. Agency for International Development and a global consortium of organizations led by WRI and EDF. He brings 27 years of experience with the U.S. EPA, where he worked with cities and states to build capacity to address climate change and air pollution, and he advocated to make environmental data more accessible.

What first got you interested in environmental science, and what do you find most interesting about this field?
I started my career as a mechanical engineer, doing things such as evaluating alternative refrigerants. Within a few years I learned about the impacts of climate change and I realized that I wanted to apply my analytical skills to issues that make a difference. This work on the Catalyst interests me because it involves so many dimensions. Technology, human health, collaboration–you need all of these ingredients and more to affect change on many environmental issues.

Why is open, publicly available data so crucial for solving environmental problems?
It’s hard to solve environmental issues because the causes and effects are complicated. In order to present a convincing case to decision-makers you need to speak their language, using numbers and sometimes stories. But you can only crunch the numbers if you can get the data, so it’s critical that data collectors make their data accessible and usable. 

If governments collect data for one purpose, it makes sense to get more value out of the data by making it available for other purposes. For example, EPA collects data on air quality for regulatory purposes, but community groups may want to use that same data to understand if their air quality has suddenly shifted to be worse. AirNow is a great example of how EPA makes their data available for non-regulatory purposes.

How can more data on air quality improve people’s lives?
Air quality affects some portions of the public more than others. For example, some people can only afford to live or work where pollution levels are high, such as near power plants, roadways or outdoor waste burning. The Clean Air Catalyst is finding ways to help people in the pilot cities (Jakarta, Indonesia; Indore, India; and soon, a third city). We use data from existing air quality monitors and analyze where the pollution is coming from. Then we increase awareness of the pollution – and ask people what they experience in their daily lives. Then we collect more air quality data to complement the existing monitors. After we analyze a few dimensions – health, climate change and gender – we evaluate which actions provide lasting benefits and work with communities to implement them.

Is there something about air quality monitoring that you’re especially excited about right now?
I’m really excited about people using data to affect change. They’re thinking beyond the accuracy of individual sensors and focusing instead on how they can use data to make decisions. That’s where the true value is, the benefit to health and society. Communities can use data from a few nearby sensors to understand if air quality is getting better or worse. That might be enough information for people to change their habits and protect themselves, for example by not exercising during hours when pollution levels are high.

What are some goals you have for the Clean Air Catalyst program?
I want the Clean Air Catalyst program to help cities improve their air quality in ways that are effective and sustainable. We’re using a lot of innovative methods in our pilot cities so we don’t exactly know which activities will be the most successful. However, we’ll learn from the experience and share the lessons with other cities so they can make progress easier. In parallel, we’re fostering two types of coalitions. First, we’re bringing several sectors together at the local level. Second, we’re connecting global and local experts so they can collaborate about feasible interventions. Follow our progress and feel free to suggest ways to make lasting improvements to air quality.

Learn more about the Clean Air Catalyst program here.

Posted in Health, Homepage, Monitoring, Partners, Science / Comments are closed

Why emission intensity matters

High-intensity emitters disproportionately pollute the air we breathe. Understanding where sources contribute the most potent emissions can help drive smarter clean air solutions.

Cutting the most damaging emissions from the air can be a bit like picking which foods to limit in your diet. You know the concept—fruits, vegetables, whole grains and lean proteins contribute far less to obesity than chocolate cake, cheesy pizza or greasy burgers. Healthy eating means paying attention not only to how much we consume but also the composition of each item.

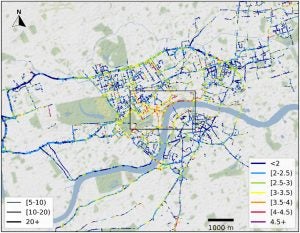
The same can be true for controlling emissions of harmful pollutants like nitrogen oxide (NO), nitrogen dioxide (NO2) and small particles. Some “high-intensity” sources—like ships, diesel generators and heavy-duty trucks—produce more potent pollution than new, gasoline-fueled passenger vehicles.  In addition, conditions like stop-and-go traffic, larger cargo loads, and driving up hill can increase emission intensity, compared to freely flowing, lighter-duty traffic. Pollution varies from block to block and city to city, so understanding where sources contribute the most potent emissions can help us tailor more effective, local solutions. Our recent paper maps London’s air pollution and hotspots of emission intensity on an unprecedented street-by-street scale.

How to spot high-intensity emissions

In London, our teams used Carbon Dioxide (CO2), a key indicator of combustion, to determine the intensity of NO and NO2 pollution (NOx, in combination). Taking on-road air pollution measurements every second using mobile instruments, we identified local peaks in CO2, signaling recent emissions.  Then we calculated the emission intensity for these events as the ratio of NOx to CO2 concentrations.

Why emission intensity matters

Our measurements coincided with the implementation of Central London’s Ultra-Low Emissions Zone (ULEZ), where highly-polluting vehicles must pay a fee to enter the city center. This policy led to a cleaner vehicle fleet in and around the ULEZ and 35% lower total NOx emissions in the first year, even as overall traffic volume stayed about the same, by effectively reducing the emission intensity of individual vehicles. In fact, the ULEZ has been so successful that the Greater London Authority expanded it to an even larger area.

Emission intensity mapped in Central London. For more information on the image or to read the article, visit the journal Atmospheric Environment.

While the Central London ULEZ and its recent expansion are effective, air quality remains poor throughout London, and hot spots remain. By measuring emission intensity, we understand more about the overall causes of pollution than if we had relied solely on total concentration measurements. By digging deeper, we can show where higher-intensity sources, like heavy-duty diesel, are having a disproportionate impact on air quality. For example, we saw higher-intensity pollution along the Thames river near shipping piers, heavy construction sites and poorly-timed lights that caused traffic jams.

Crafting smart policies to combat air pollution

Equipped with local, street-scale emission intensity data, in addition to more typical total pollution measurements, policymakers in London and beyond can craft tailored solutions to cut air pollution and improve health. Some changes are easy, actionable and don’t require legislation—like fixing poorly-timed traffic lights or enacting anti-idling rules at passenger bus terminals. Other fixes—like limiting the number of warehouses that can be sited in one area to reduce truck traffic, staggering the timing and location of construction projects in order to reduce emissions from heavy equipment, electrifying buses or reducing the number of used, dirty vehicles in operation—would require more political will.

While we need to reduce all combustion-related emissions to achieve air quality and climate goals, using new methods to identify emissions intensity allows leaders to see where the dirtiest sources are, so they can focus initial efforts where tangible impacts are possible.


Posted in London, Science / Comments are closed

Here’s how community groups can receive funding for air monitoring

Hyperlocal air monitoring is a powerful new tool for communities that want to take charge of their air and the health consequences of pollution. The United States Environmental Protection Agency (EPA) made $20 million available for a new community air monitoring grant program, with no cost-sharing needed. EPA is encouraging community-based organizations to apply for the grants.

The impact of community-driven monitoring is impressive and growing. Interest in community monitoring is inspired, in part, by gaps in the current monitoring networks operated by federal and state governments:

  • Pollution can be as much as eight times higher at one end of the block than the other. This variation has major health impacts: Oakland neighborhoods with higher percentages of residents of color experienced double the rate of childhood asthma from traffic-related air pollution (nitrogen dioxide) compared with predominantly white neighborhoods.
  • Many of the monitors capture data only one out of every six days, and a recent study found that companies pollute more when the government isn’t watching.
  • Satellite data shows that millions of people may be breathing air that doesn’t meet the legal minimum standard in the blind spots around federal regulatory monitors.

Hyperlocal air quality monitors can demonstrate how air quality levels can vary block by block.

Communities are applying local data to a variety of exciting uses. They are securing new regulatory monitors, achieving funding for pollution reductions, reducing truck traffic into waste transfer stations, challenging permits for warehouses, demanding more transparency for truck-attracting facilities, inspiring student engagement, educating residents about health impacts of air quality, and much more.

The funding

The EPA funds are intended “to support community and local efforts to monitor their own air quality and to promote air quality monitoring partnerships between communities and tribal, state, and local governments.” Grant sizes range from $25,000 to $500,000. Eligible entities are states (including the District of Columbia); local governments; U.S. territories and possessions; Indian tribes; public and private hospitals and laboratories; and other public or private nonprofit organizations. $2 million is set aside for tribal governments, and $2 million is set aside for eligible community-based organizations. Projects must be completed within three years.

Further details can be found here. The application deadline is March 25, 2022.

If you believe more funding can help you strengthen hyperlocal monitoring in your community, below are some resources that might help. This is not an exhaustive discussion of application requirements. Applicants should review the information package.

A few resources:

Here are some tips for completing the grant application.

Posted in Community Organizer, Environmental Justice, Monitoring, USA / Comments are closed