Digging deeper into London air pollution reduction with Waze
Written By
Share
Editor’s Note: Today’s post is by Meg Dupuy-Todd, a Manager at Environmental Defense Fund. Meg has led projects as a part of EDF’s Global Clean Air initiative, including collaborations with Google’s Project Air View in London and Salt Lake City.
Covid-19 has disrupted everyone’s lives, including providing an unfortunate and unwelcome experiment to examine London’s changing commuting and pollution patterns.
At Environmental Defense Fund, we have been collecting air quality data as part of Breathe London, a collaborative project to map and measure pollution in London. We could see that the social distancing measures had changed nitrogen dioxide (NO2) pollution levels, but we wanted to provide a fuller picture and determine what factors might be at play, including traffic.
Here’s how we used Waze for Cities data to dig deeper into the cause of observed NO2 pollution reductions.
NO2 pollution changes
The Breathe London consortium, with partners including Google Earth Outreach, has collected hyperlocal data to help Londoners better understand pollution in the city. Displayed in real-time on an interactive map, the Breathe London project measures and displays data from air quality sensors across the city.
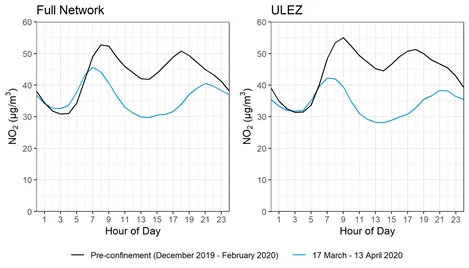
After social distancing was strongly encouraged in the city in mid-March, the Breathe London monitors saw substantial NO2 pollution reductions — across the full network and especially in the city’s Ultra Low Emission Zone (ULEZ) in Central London. The greatest reductions occurred during daytime hours, between 6:00–22:00, when we also expected traffic to be the highest.
Exploring Waze data
It was a given that restrictions to help reduce the spread of Covid-19 would change traffic patterns, as workplaces and businesses closed and many people began to work from home. As road transport is a major source of NO2 pollution, naturally, our assumption was there was a link with fewer vehicles on the road.
Through partnership with Waze for Cities program, we had access to Waze-generated anonymous incident and slow-down information in Greater London. Could the data help us understand where and how traffic had reduced?
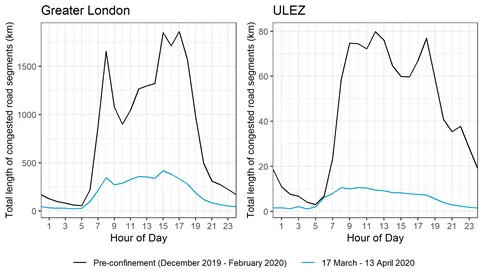
From previous reviews of Waze data, we knew it would not provide us direct information on traffic volume — the number of vehicles on the road. Instead, we relied on the reported congestion information comparing speed on roads as compared to free-flow traffic. Using Google BigQuery, we were able to analyze the large volume of spatio-temporally resolved data to begin to get a picture of daily traffic congestion in London. Using two distinct geographical boundaries (Greater London and the ULEZ), we decided to calculate, for each hour of the day, the total length of roads where traffic was less than 60% of free flow speed as our proxy for traffic.
With our analysis, we saw that traffic congestion reduced to such an extent that it was approaching free-flow in the vast majority of Greater London roads after the stay-at-home order, even during what used to be peak commuting hours. This is most pronounced in the mostly commercial ULEZ.
Putting it all together
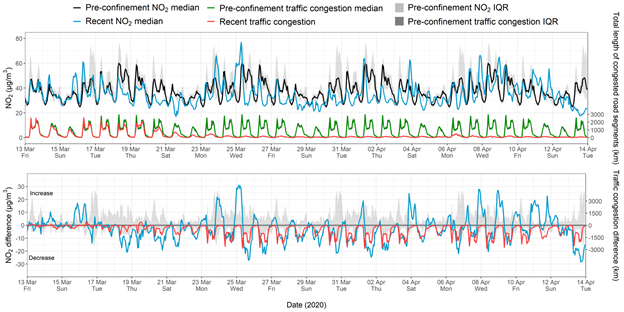
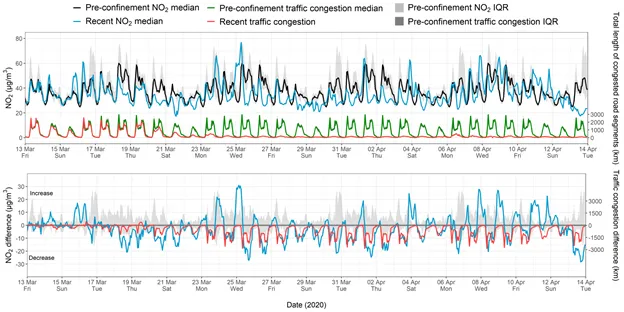
With both datasets in hand, our team was able to look at the differences over time of NO2 pollution and traffic congestion. We knew that traffic varied by day of week, so we compared the data to a pre-confinement median by day of week and hour of the day.
We found an apparent association between the reduced pollution levels and lower traffic congestion in London. Examining the daily pattern of traffic congestion also suggests a tie between the biggest drops in pollution and the biggest drops in congestion — which both occur in the late afternoon from around 3 to 7 pm. You can see this depicted in the chart below. Note the difference in “variability in road congestion due to traffic during confinement” (shown in red) and the “weekly congestion average” (shown in green).
There is still a lot more to learn about the changes in road transport emissions and the relationship to measured pollution, but by incorporating the Waze data into our Covid-19 analysis we were able to shed new light on why NO2 pollution has recently gone down in London.
To learn more about our assessment please visit BreatheLondon.org/covid19.
This was originally posted on Medium.