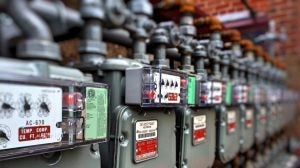
Innovative measurement tool will help Illinois calculate the benefits of smart-grid investments
 Even as the Trump administration moved last week to repeal the Clean Power Plan, some of the biggest American utilities indicated they’ll continue investing in clean energy and strategizing around climate change.
And as they continue investing in smart meters and other grid modernization efforts, utilities will want to know how well they do. Are grid programs fulfilling environmental promises and cutting pollution? Can they measure success and prove to investors and regulators they’re making smart decisions?
In Illinois, electricity providers Commonwealth Edison (ComEd) and Ameren are the first in the country to adopt a new tool that calculates clean air benefits from investments such as advanced meters. ComEd began using the tool last year, and now Ameren will follow suit.
Beyond bringing tangible rewards to the utilities, this little-noticed milestone can have major implications for the entire power industry.
Billions for smart grid
After Illinois passed the Energy Infrastructure Modernization Act in 2011, channeling $3.2 billion to ComEd and Ameren to modernize the grid, the companies began to replace customers’ conventional electric meters with smart meters. The new devices make it easier to provide energy savings programs and other clean energy services, while helping utilities reduce outages.
[Tweet “Innovative measurement tool will help Illinois calculate the benefits of smart-grid investments”]
The companies have now deployed approximately 4 million meters across the state, along with other sensing and control technology.
This is where the first-of-its kind metric comes in.
ComEd started to use the measurement tool last year to calculate and report to state regulators greenhouse gas reductions from its new and advanced energy infrastructure. Environmental Defense Fund (EDF) and the Citizens Utility Board (CUB) – Illinois’ premiere utility watchdog – developed the metric. Initial results show ComEd has already lowered greenhouse gas pollution, for example through dispatching fewer outage and maintenance related vehicles.
Now Ameren will work with EDF and CUB to design the specifics of the metric so it can begin to use the tool across its territory.
The initiative serves, in essence, as a pilot project for other power companies that want to build a modern grid.
This metric…does what, exactly?
By determining the carbon value of a kilowatt-hour of electricity for all 8,760 hours in a single year, the metric can pinpoint how much pollution the smart meters are keeping out of the air. Utilities can now show investors and the public that they are meeting air-quality goals.
For example, when power comes from high-carbon coal, using a kWh of this electricity results in more carbon pollution than when power is coming from mostly low-carbon wind or solar.
The metric will be able to track greenhouse gas reductions.
Advanced meters can also open the door for numerous clean energy and smart grid tools, such as energy efficiency and demand response, which rewards customers for conserving electricity when the grid needs it most. The metric will be able to track the greenhouse gas reductions associated with all of these efforts, and more.
Rewards too good to pass up
As ComEd and Ameren continue their advanced meter rollout, the utilities hope to be rewarded accordingly. Illinois offers higher earnings for utilities that show they’re meeting the goals of the state’s grid modernization plan.
As the companies gain more experience with the metric’s use, they will also be able to incorporate the findings into future plans and make more informed investment decisions going forward.
Carbon-emissions tracking could open doors for new businesses and products.
Moreover, carbon-emissions tracking could open doors for new businesses and products. For example, EDF Europe, alongside collaborators National Grid, Sandbag, and World Wildlife Federation, recently released the Green Energy Forecast Tool, which combines U.K. energy and weather data for software designers to access for free online. From there, they can design apps that show consumers the real-world impact of their electricity use on a particular day.
Nearly half of all American households now have smart meters generating utility data about daily energy use, and the Illinois greenhouse metric and Green Energy Forecast Tool are just the tip of the iceberg of what’s possible when marrying energy-use data with other datasets. Illinois may be first state in the U.S. with an innovative carbon-impact tool, but it probably won’t be the last in our growing clean energy economy.
A version of this post originally ran on EDF Voices.


2 Comments
So is coal more likely to be marginal in peak hours than in off-peak hours? How do MERs vary with load level? I looked at the IMM report for Aug 2017, and it looks like coal was at the marginal less in the 1-5 pm period than the rest of the day. Since those data are PJM wide, they do not necessarily reflect the generation that would respond to load changes in Illinois, out at one end of the sometimes constrained PJM transmission system.
In the ComEd report you link to, there is no accounting for the energy used in pre-cooling before the peak-time savings events, or recovery afterwards, or the other uses (laundry, dish washing, other ho-water use) moved out of the PT event hours. Have you looked at that?
Thanks for your note. The bottom-up approach developed by ComEd should net out any increase in energy use (and corresponding GHG emissions) that occurred prior to a peak-time savings event.