Groundbreaking Study Shows New Coal Plants are Uneconomic in 97 Percent of US Counties
By: Ferit Ucar
At Environmental Defense Fund (EDF), we understand that market forces can drive either a healthy environment – or harmful pollution. I recently wrote about how generating electricity often creates pollution, which comes with environmental and health costs that are usually not paid for by the polluters. That’s why EDF works to identify and correct market failures, like the failure to understand – as well as account for – all of the costs pollution imposes on society.
The Energy Institute at the University of Texas at Austin (UT) just released a useful tool in that pursuit: a studythat aims to capture the full cost of new electric power generation – including environmental and public health costs – on a county-by-county basis in the United States. The study evolves traditional ways of estimating new generation costs by 1) incorporating pollution costs, and 2) breaking data down to the county level.
The results show economics are leading the U.S. to a cleaner energy economy, in which there is no role for new coal plants. Let’s break it down.
Enhancing the levelized cost method
The Levelized Cost Of Electricity (LCOE) method is commonly used to compute the costs of different power sources – including fossil fuels and renewables – on a comparable basis. The LCOE, expressed on a dollar per kilowatt-hour (kWh) basis, is the estimated amount of money it takes for a particular electricity generation technology to produce a kWh of electricity over its expected lifetime.
In its conventional form, the LCOE method does not take into account environmental and public health costs – costs external to electricity generation but caused by it. It also does not show the variation in costs of building and operating identical power plants across different geographies. The study provides an improved method that addresses these limitations. The study also factors in siting challenges – like water availability and access to fuel – that prevent certain plant types from being built in a given county.
The UT study presents results in a map format, which facilitates cost comparisons by fuel source, technology, and location. The study team released interactive maps that show the cheapest technology by county, as well as calculators that enable users to compare costs for different scenarios.
Key findings
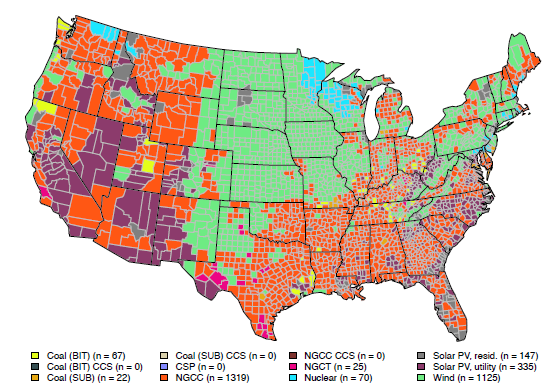
The following U.S. map shows the least-cost technology when factoring in siting limitations, and environmental and public health costs. The key displays the number of counties in which each power technology is the least-cost option.

The analysis shows:
- Wind is the least-cost option in the most number of counties.
- Coal plants are never the least-cost option.
- Natural gas combined cycle (NGCC) plants are the least-cost option in counties where the wind isn’t as strong.
- Utility-scale solar photovoltaic (PV) plants are the least-cost option in counties where it’s particularly sunny and/or there is a lack of cooling water availability, which is needed for thermal generation like coal.
- When a county faces siting challenges that prevent other technologies from being built, residential solar PV plants (like rooftop solar) are the least-cost option. Put another way, rooftop solar is a viable option in every county; other power sources are not.
If you remove the environmental and public health costs from the analysis, the map looks different:

Even without accounting for the environmental and public health costs, wind remains the least-cost option in over 1,000 counties – that’s about one third of U.S. counties. And solar appears on the map nearly five times as much as coal.
Caveats
Although the study presents an improved way to measure the costs of electricity generation, we should acknowledge its limitations. It does not:
- Remove the subsidies received by coal and natural gas during the exploration and extraction process, which effectively make fossil-fuel plants appear less costly than they actually are.
- Account for the uncertainty of future fuel prices and capacity factors for fossil fuel and nuclear plants.
- Demonstrate the environmental and public health benefits of retiring an existing fossil-fuel plant. As the study states, if emission rates from existing (rather than new) power plants were used, the public health costs would, on average, be 10 times higher.
- Factor in the costs associated with managing the variability in wind and solar’s generation output.
- Model the implications of the federal Production Tax Credits and Investment Tax Credits for renewable generation technologies, as well as subsidies at the state or local level, which affect investment decisions. (The calculators do allow changes to capital cost assumptions; so therefore, these could be factored in).
- Consider economic factors other than cost – like revenue – that also affect investment decisions.
- Account for the high-level environmental damage risks associated with electricity generation from nuclear, natural gas, and coal as a result of incidents like Chernobyl and Fukushima, Aliso Canyon, and Dan River coal ash spill that cause massive, long-term, acute, and dispersed chronic harm.
The Energy Institute study clearly shows the economic viability of wind and increasing prospects for solar.
The Energy Institute study clearly shows the economic viability of wind and increasing prospects for solar. Moreover, it provides policymakers and the public with important information on the full cost of electricity for new power sources – including the environmental and public health costs such as asthma attacks, premature death, and lung damage resulting from fossil-fuel pollution.
When pollution costs are accounted for, as the UT study shows, coal power plants are not the lowest-cost electricity generation technology anywhere. Even without including environmental and health costs and renewables subsidies, and despite the fact extraction of coal remains subsidized, new coal plants are still not economic in 97 percent of U.S. counties. As we work to fix outdated rules, we know that market forces are helping to clear the way for clean energy progress and cleaner air.
This post originally appeared on our Energy Exchange blog.


