


This post originally appeared on the EDF Global Clean Air Blog.
Ananya Roy, Senior Health Scientist, and Maria Harris, Environmental Epidemiologist
The last several months have seen a wave of momentum in policies seeking toward advance environmental justice and equity through better data collection and mapping. In his first week in office, President Biden signed an executive order to initiate the development of a screening and mapping tool to identify disadvantaged communities with the goal of informing equitable decision making. And legislation introduced in the House of Representatives and Senate would launch a similar effort. This focus on data and mapping is critical.
At EDF, we’ve worked with community and research partners to map air pollution at the block-by-block level, and found that hyperlocal data can reveal pollution hotspots and variability within cities and neighborhoods that would otherwise be missed. Building on this research, our latest work shows how the health impacts from air pollution can vary at a hyperlocal level and how using local level data can greatly improve our ability to identify health disparities and target action. Our findings illustrate why it is important to incorporate health information into such decision-making, as both pollution exposure and health vulnerability influence the health impacts of air pollution.
These insights have relevance not only for actions at the federal level, but also for cities and states across the country that are seeking to reduce air pollution and address health inequities.
Air pollution has major – and unequal – health impacts
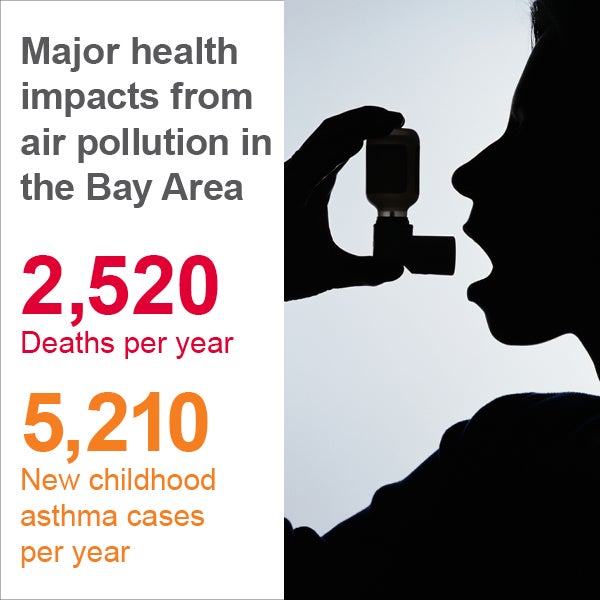 Our analysis, conducted with George Washington University and recently published in Environmental Health Perspectives, revealed the enormous toll that air pollution takes on health across the Bay Area. We estimated that traffic related pollution is responsible for more than 2,500 deaths and 5,200 childhood asthma cases every year.
These impacts vary dramatically from street-to-street. Within the Bay Area, certain areas experience death rates from pollution that are more than 30 times higher than other areas.
Further, there are major disparities in these impacts across racial and ethnic groups. On average, Bay Area neighborhoods with higher percentages of people of color experienced double the rate of childhood asthma from traffic-related pollution compared with neighborhoods that were predominantly white.[1] This disparity reflects the higher air pollution levels faced by communities of color, a burden driven by decades of discriminatory housing and planning policies and disinvestment.
Pollution levels alone cannot predict impacts
How air pollution impacts health is not solely a result of the level of pollution, it is also influenced by underlying health disparities. That’s why health impact assessments, like our study, use information about existing health conditions and population distribution, along with air pollution concentrations, to estimate impacts.
By incorporating information about existing health status, these assessments shine a light on how air pollution adds to the cumulative burden in neighborhoods with greater vulnerabilities. In developing mitigation policies that seek to reduce health disparities, it is critical that stakeholders consider data on both population health vulnerability and pollution exposure, rather than relying on air pollution data alone to inform decisions.
Without local data, estimates won’t tell the full story
Usually, estimates of air pollution’s health impacts are reported at the county, state, or national scale, using modelled air data and county, state or national health rates. This scale of reporting can mask important differences in impacts across neighborhoods.
By using hyperlocal air measurements from mobile monitoring and health data at the census block group scale, our analysis uncovered disparities and hotspots of impacts that would not have otherwise been recognized. We found that using less-detailed health data would’ve underestimated the number of deaths attributed to pollution by up to 50% in our Oakland, CA study area.
The below figure compares maps of the death rates from air pollution in West and Downtown Oakland using different scales of data – moving from less-detailed (on the left) to more-detailed (on the right). The map on the left, which does not reflect local pollution and health data, misses health risk hot spots and underestimates the magnitude of disparities.
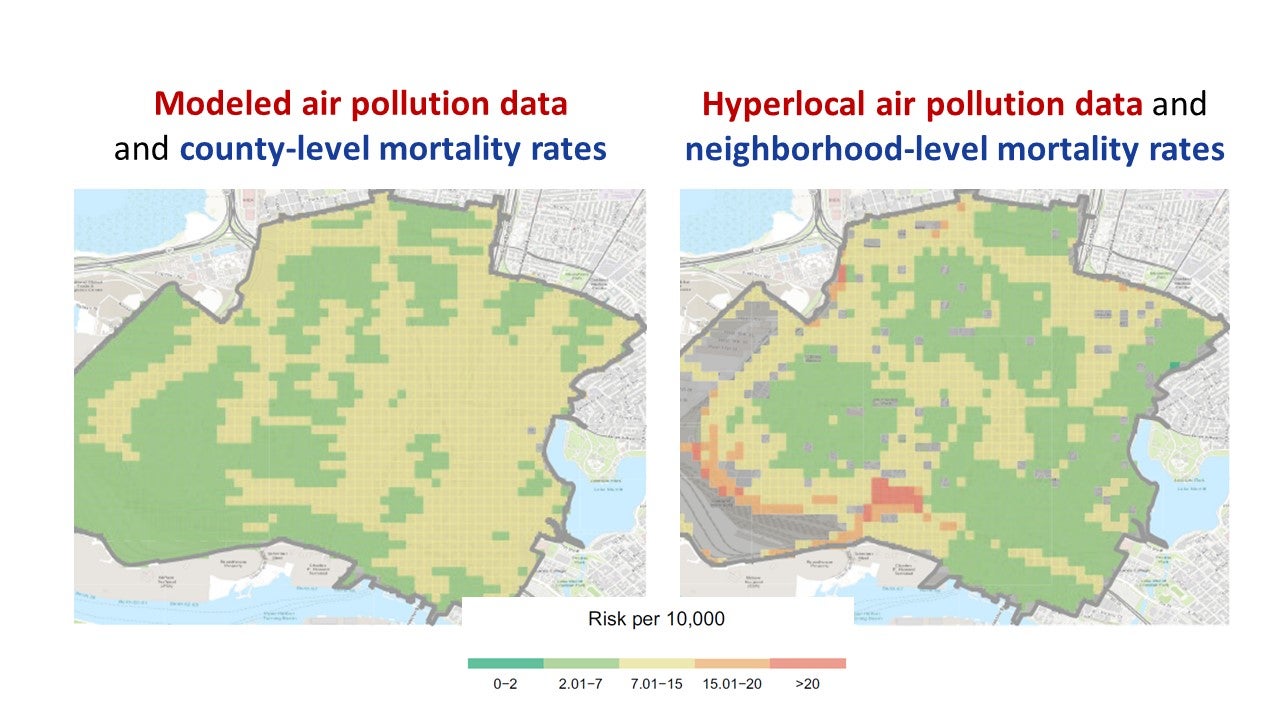
Comparison of maps showing death rates from air pollution using less-detailed health and air pollution data compared to local data.
Further, the scale at which health impacts are reported also matters. For example, while county average death rates from nitrogen dioxide vary by a factor of less than 2 across Bay Area counties, average death rates for 100 meter ✕ 100 meter areas within those counties vary by a factor of 38.
How better data can inform more equitable policies
Policies to address air pollution will be more effective at reducing inequities when they are informed by local health and air data, at a scale which captures disparities. This local data allows decision-makers to prioritize actions that will have the greatest health benefit and help those most at risk. For example, this could include investing in electrification infrastructure (e.g. charging stations) in areas that face a particularly high health toll from pollution.
The collection of better baseline health data and more air pollution monitoring could greatly improve these efforts. And, as has been clear from attention at the federal level on this issue, there is growing understanding of the importance of data for developing equitable policies to reduce pollution and protect health.
While gaps and challenges remain in replicating and improving the analysis we conducted in the Bay Area, the implications of the research are directly relevant at the city, state, and federal level as policymakers seek to make progress on air pollution. Our study shows that the health impacts of air pollution exposure differ across neighborhoods within the same city, and that disparities are driven by both pollution exposure and health vulnerability. These findings demonstrate the importance of incorporating health data – ideally at the local scale – into policies and tools that seek to identify and prioritize areas where air quality needs to be improved.
__
[1] Comparing average estimated annual rate of new pediatric asthma cases attributable to nitrogen dioxide for Bay Area census block groups in the top quartile of proportion people of color (>76% people of color; 31 cases/10,000 people) versus census block groups with the lowest quartile (<33% people of color; 15 cases/10,000 people).