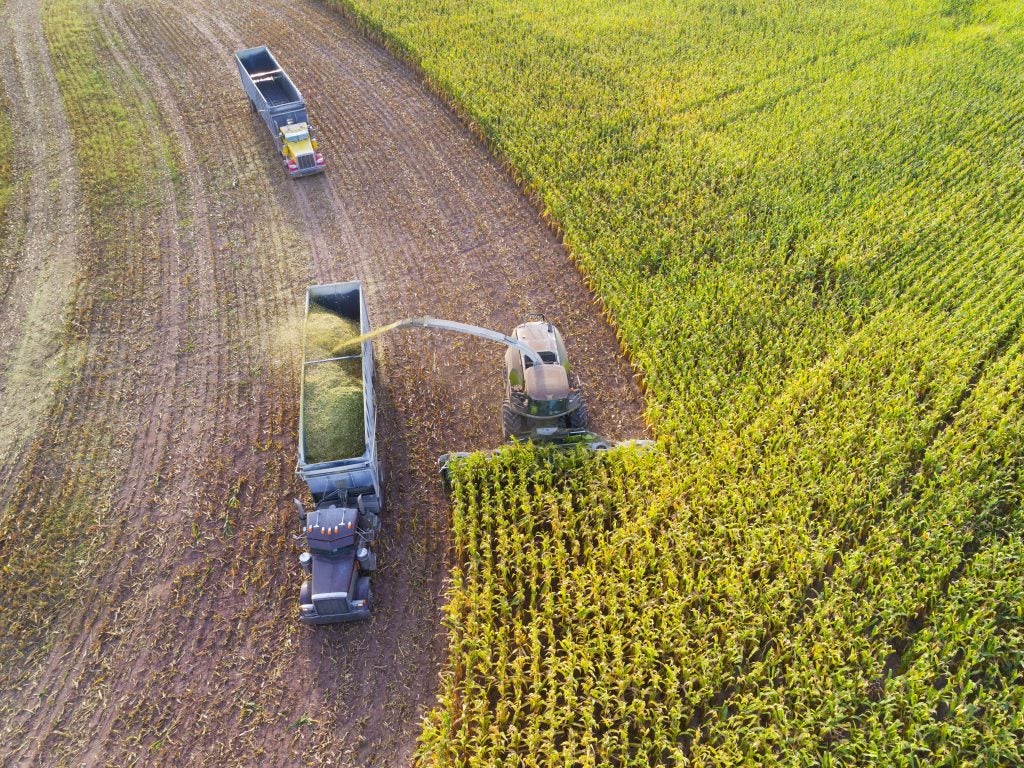
Environmental Defense Fund led several pilot projects in the 2019-2020 growing season to better understand how different farm management practices impact nitrogen balance, or N balance, a robust and practical proxy to measure agriculture’s climate and water quality impacts.
EDF scientists assessed real-world, in-field data for 16 management practices and N balance scores from more than 500,000 acres of corn across nine Midwestern states. Here are four actionable insights.
1. Nitrogen fertilizer application rate is critical
Both nitrogen application rate and crop yield influence a field’s N balance score, but application rate has a greater impact on variations in N balance scores.
If the applied nitrogen rate is excessively high, any potential benefits or improvements from other management practices become inconsequential. For example, if a grower applies nitrogen at a rate that results in an N balance score that is 100 lbs. N/acre above the safe zone range, incorporating other management changes, such as improved fertilizer timing or adoption of cover crops, will not return a significant improvement in the N balance score.
Application rate must be addressed first; then other appropriate management changes can be made.

N balance is the nitrogen added to a farm field minus nitrogen removed during harvest. The remaining nitrogen is vulnerable to being lost to the environment.
2. Growers who apply manure tend to have higher N balance scores
Fields with manure applications, whether as the primary or secondary nitrogen source, tended to have higher N balance scores, on average 55 lbs. N/acre greater than fields not receiving manure.
Manure can be extremely beneficial, helping to build soil organic matter and reducing nitrogen input costs, but our data show that some growers fail to account for nitrogen applied via manure and do not subsequently decrease synthetic nitrogen applications, resulting in persistently high N balances year-over-year.
Here's what scientists learned about nitrogen management after assessing data for 16 conservation practices across more than 500,000 acres of corn in the Midwest Share on X3. Trusted advisers can help improve N balance scores
Growers who worked with a state grower group or an independent crop consultant tended to have N balance scores within or nearer to the safe zone compared to farmers who were unaffiliated.
EDF saw evidence of improved nutrient management and lower risk of nitrogen losses to the environment as a result of the service-oriented relationship between these groups and their growers, with the groups serving as trusted advisers and providing guidance for farm management decisions.
4. Understand where high N balance scores are occurring
In this data set, a small number of growers contributed the majority of nitrogen to the environment.
Approximately 90% of excess nitrogen above the safe zone range came from only 20% of the participating growers. In other words, 20% of growers contributed about 90% of the nitrogen at high risk for environmentally damaging losses.
This should inform intervention strategies. To see the biggest improvements, conservation policies and programs should engage these growers directly, rather than taking a less targeted outreach approach.
Visit edf.org/n-visible for additional information about how to use N balance to measure and improve environmental outcomes.


